The critical minerals must flow
Past, present and future energy geography
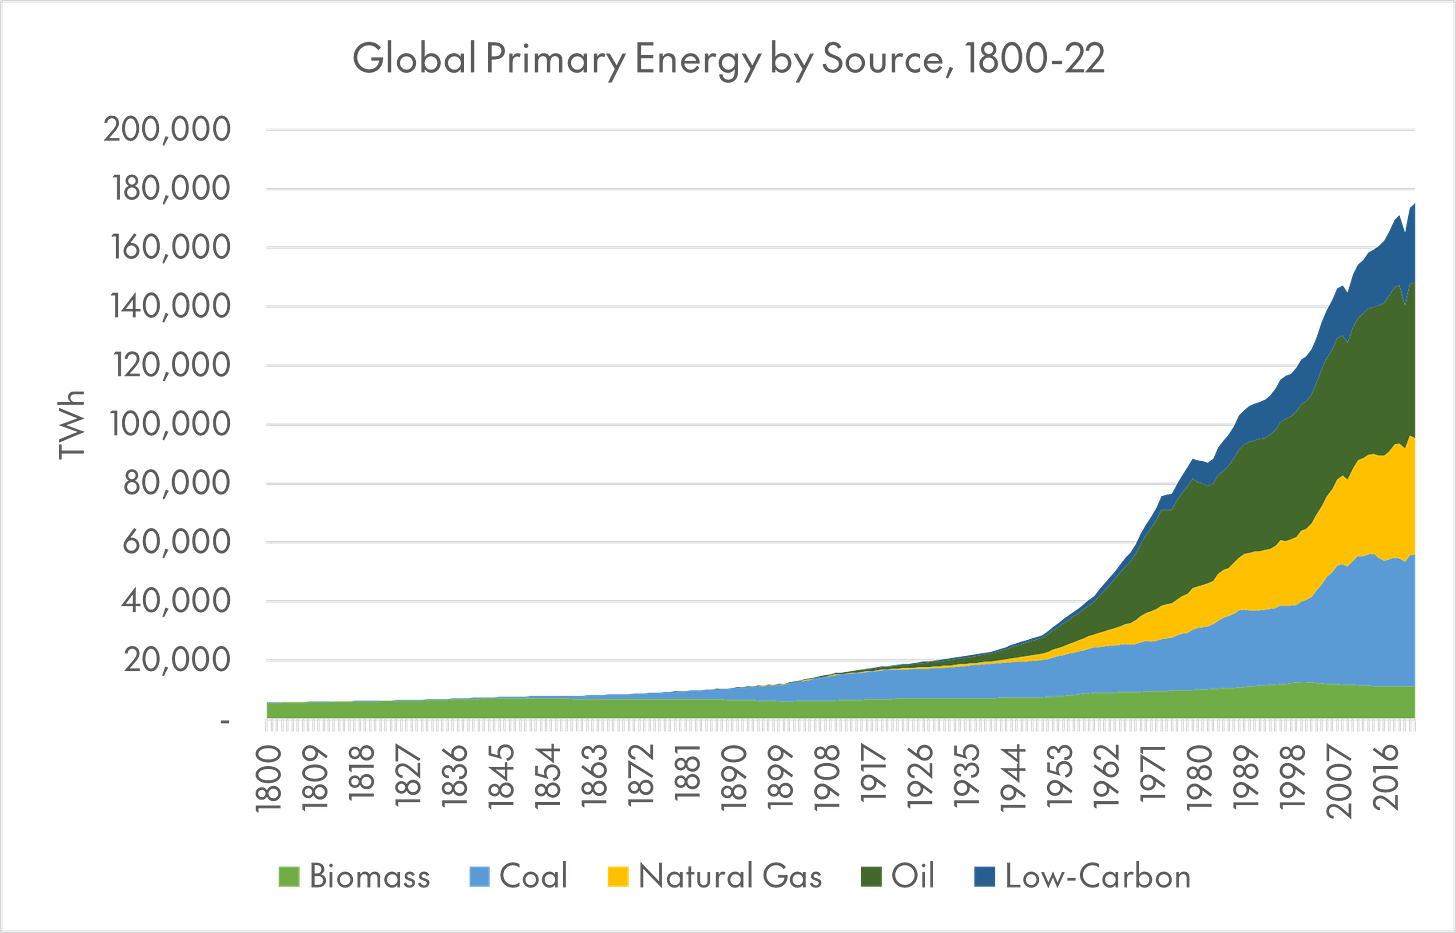
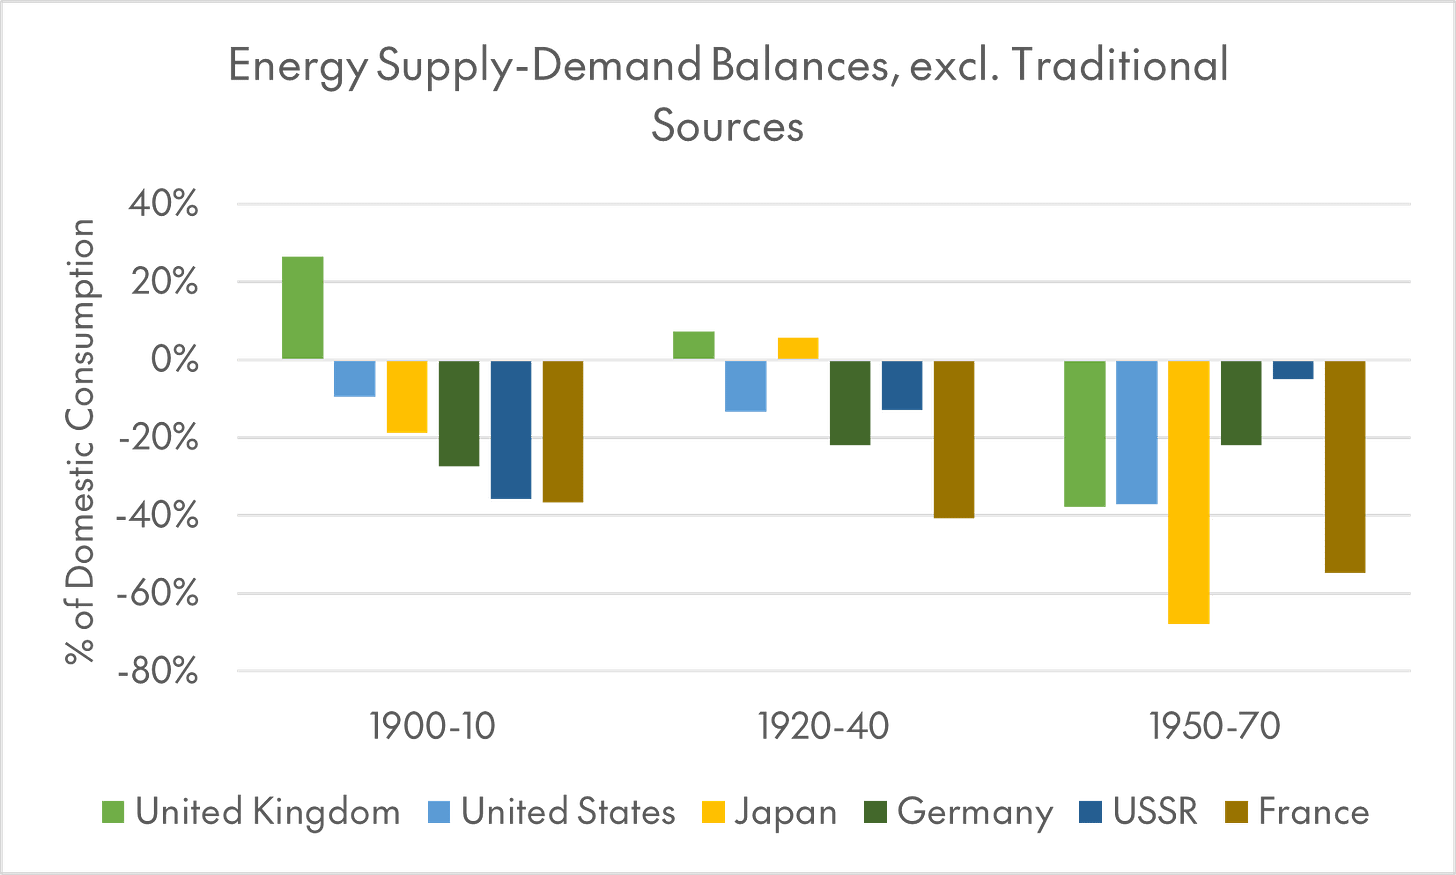
We tend to take it for granted that the energy we rely on every day travels thousands of miles via tankers, rail cars, and pipelines to reach us. “Traditional biomass,” or firewood, peat, and dung, all of which tend to be collected close to where they are used, made up a majority of world energy consumption as recently as 1900. In the early decades of the 20th century, coal and later diesel powered new, high-speed transportation networks that encircled the globe with railroads and steamships. But energy was still mostly produced close to where the demand was, in the industrial core of the world economy - the United States, Western Europe, Japan, and the USSR.1
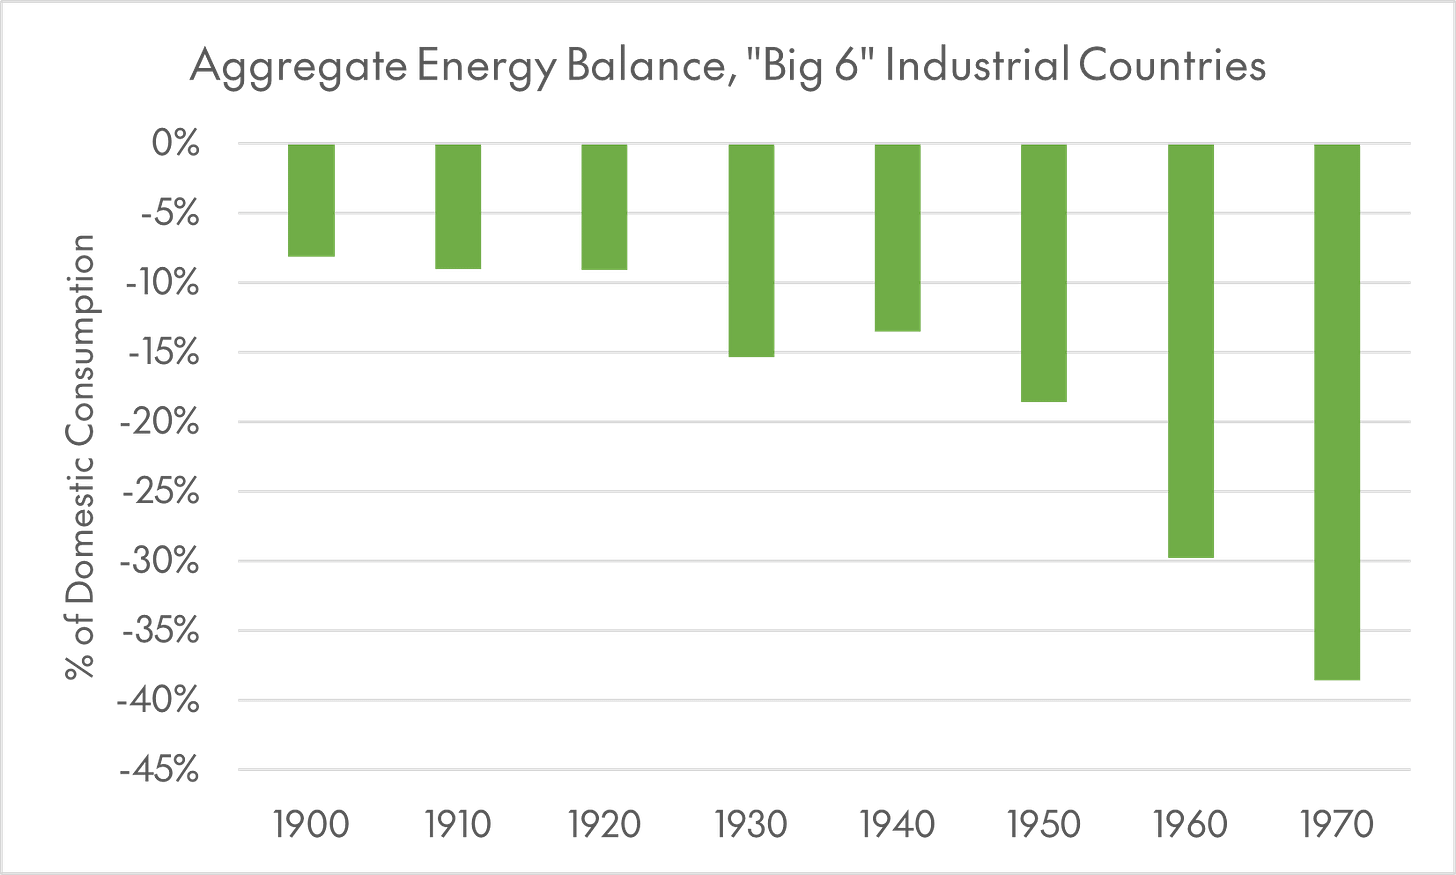
Before World War I, the six biggest industrial economies collectively produced over 90 percent of the energy they needed. This fell to 85 percent during the interwar period. It was the postwar growth of crude oil demand, buoyed by the automobile, aviation, and chemical industries, that radically reshaped global energy geography, and made long-haul trade in hydrocarbons so important to the world economy.2 In 1950, coal still made up 44 percent of the world’s energy consumption (or 60 percent excluding traditional biomass). By 1970, with coal demand growing just 35 percent over the intervening 20 years even as overall energy use doubled, it made up just over 25 percent. Domestic energy production made up only around 60 percent of energy needs in the industrial core.
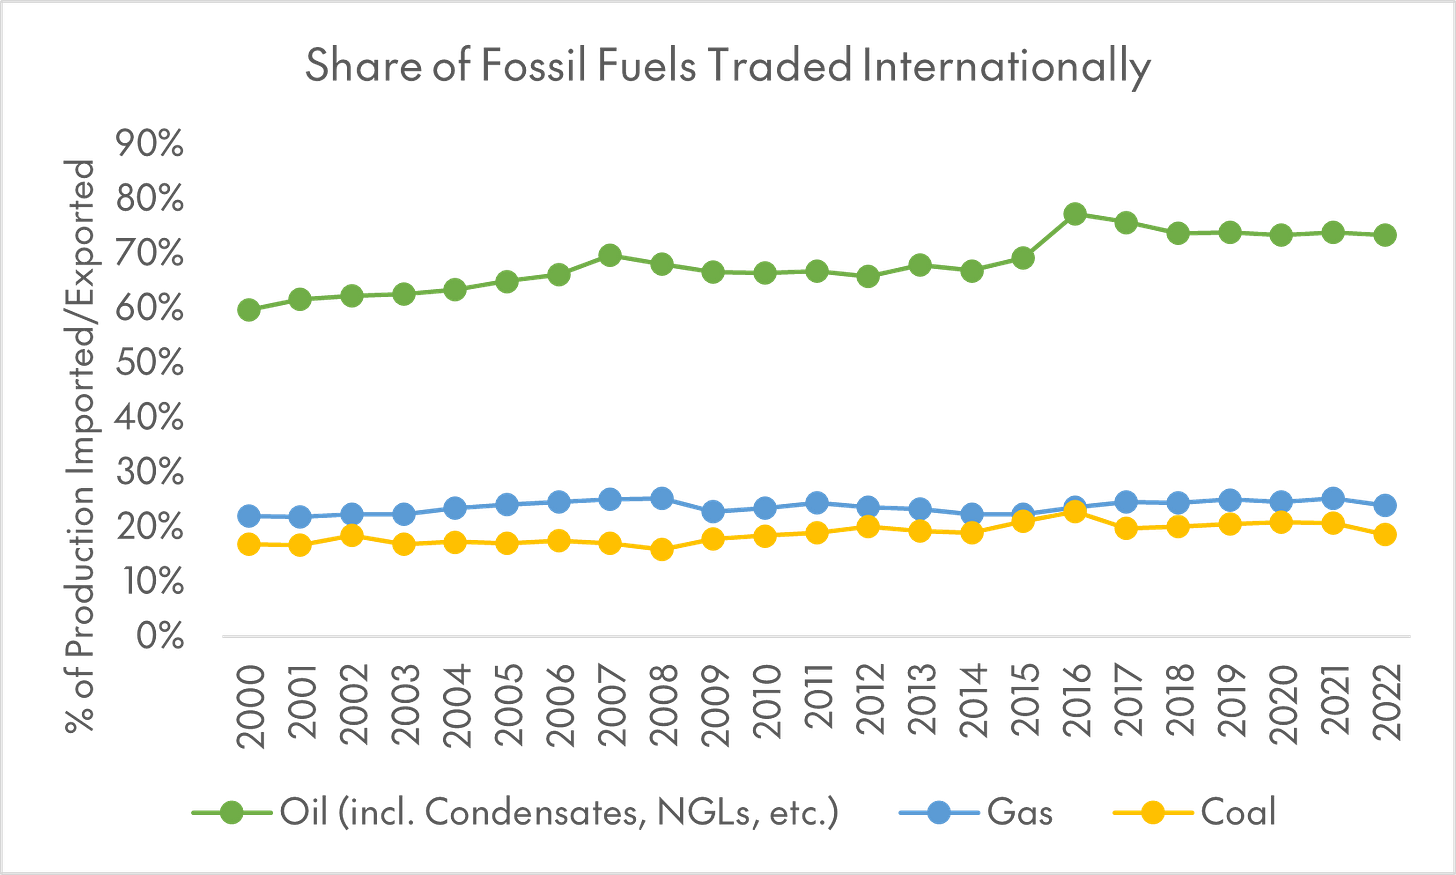
Figs. 1-2: Crude oil is far more likely to be traded internationally than coal and gas, which are mostly consumed domestically. The postwar transition to an oil-dominated global energy system also meant a transition to longer, seaborne energy supply chains.
(Statistical Review of World Energy; Our World in Data)
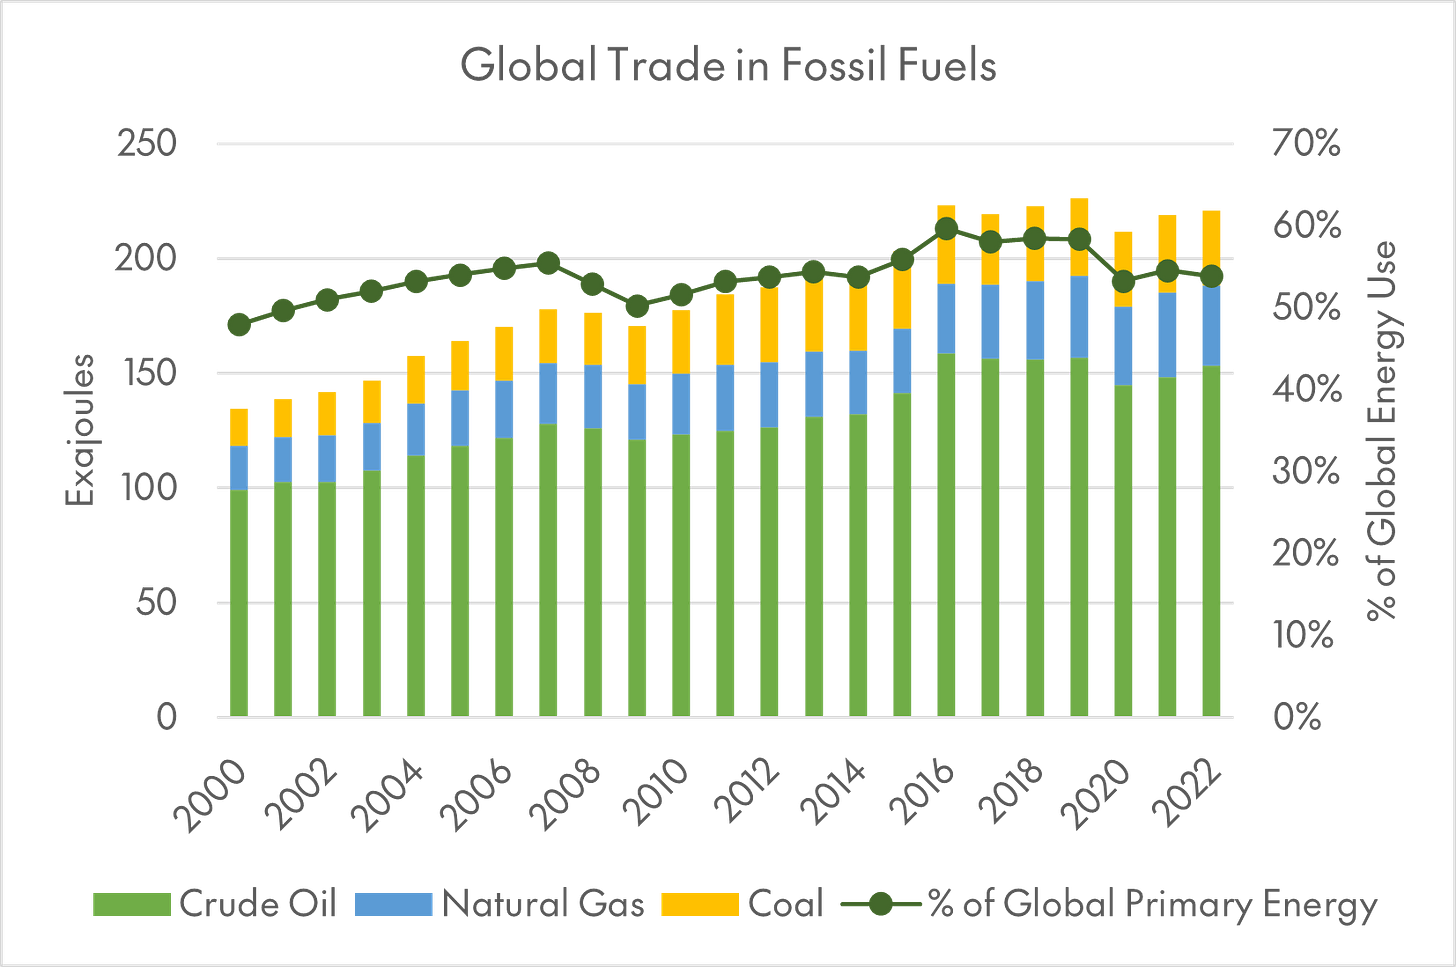
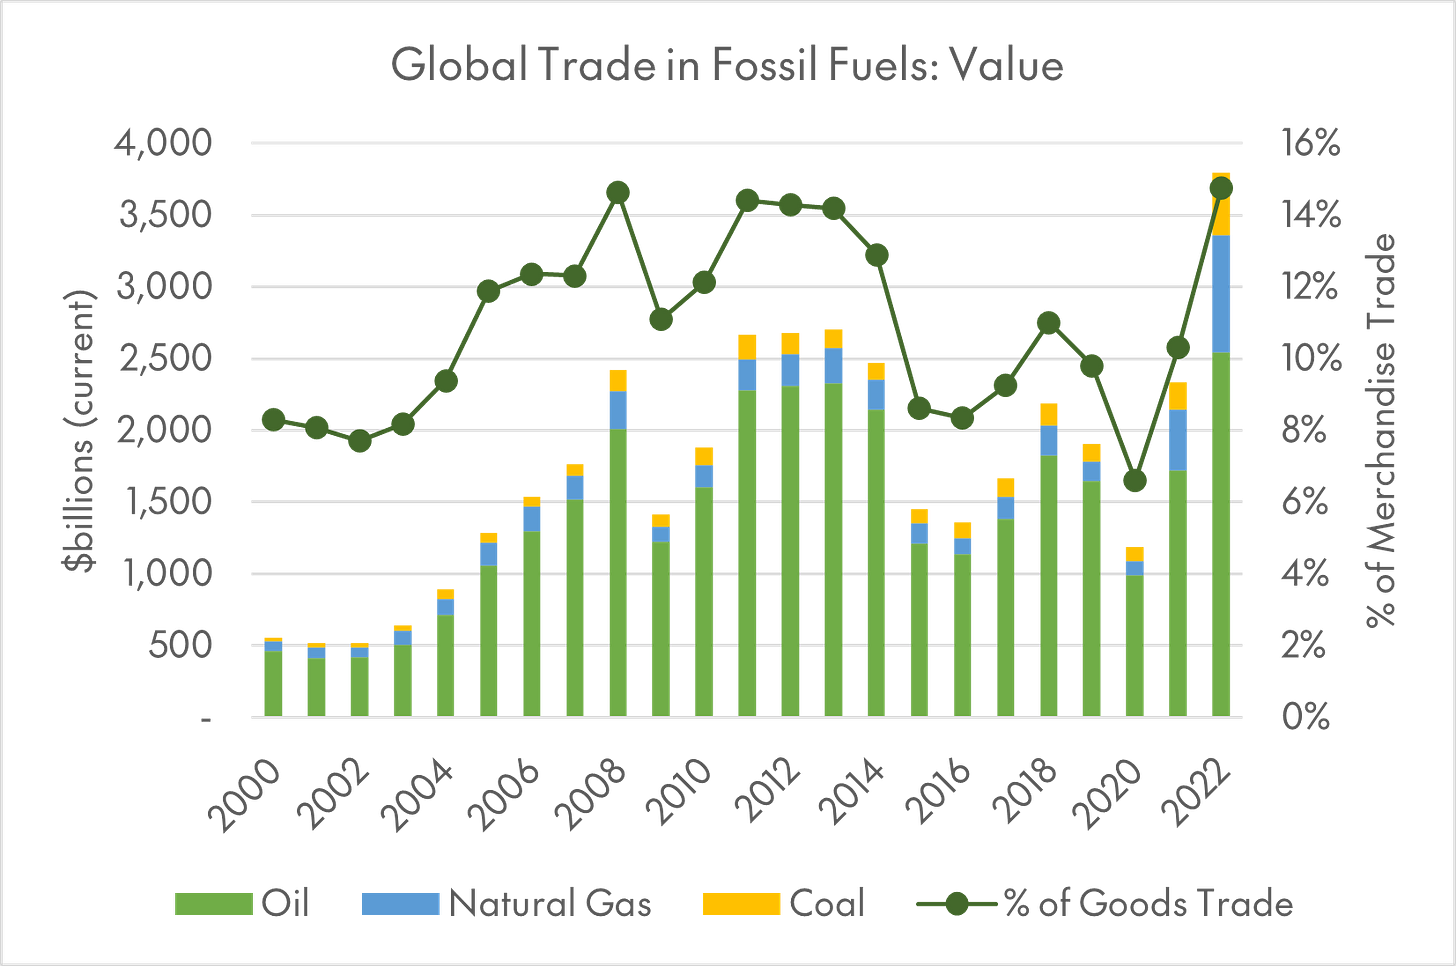
Cross-border trade in fossil fuels adds up to about 50 to 60 percent of global energy consumption each year. In energy terms, it totals around 220 exajoules. The scale of these commodity flows is so huge that the numbers feel meaningless, like looking at a distant landmark without any people in the foreground: 8 billion tonnes of coal, a trillion cubic meters of natural gas, 25 billion barrels of oil. In dollar terms, annual oil, gas, and coal imports have typically ranged from $1.5-2.5 trillion over the last ten years, surging to nearly $4 trillion in 2022 at prevailing prices. That means fossil fuels make up around 8 to 12 percent of all global trade in goods.
Figs 3-4: Global trade in fossil fuels runs to a little over half of the world’s energy consumption (~220 EJ) and around a tenth of all trade in goods (~$2.5 tn). Oil makes up a disproportionate share of fossil fuels changing hands internationally, in both energy and dollar terms.
(Statistical Review of World Energy; World Bank Open Data)
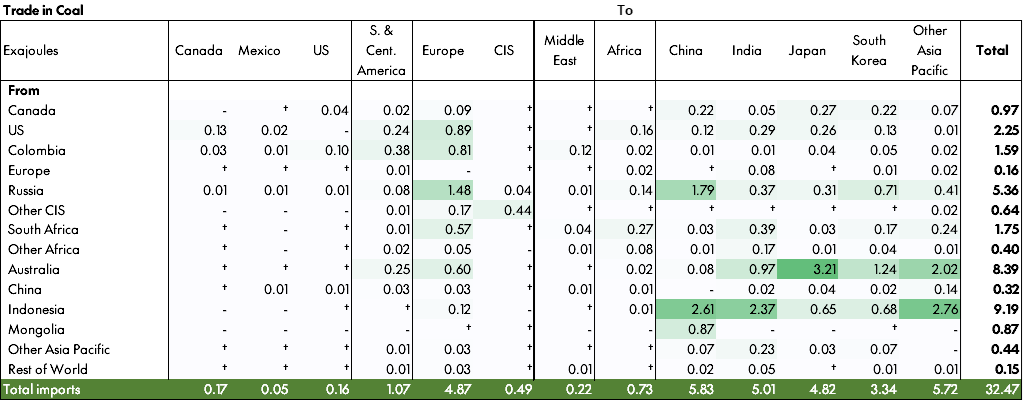
A few trade routes dominate fossil fuel flows. Two thirds of world trade in coal flows from just four countries - Indonesia, Australia, Russia, and Mongolia - to demand centers in East and South Asia. The vast majority of this trade (half of world trade in coal on its own) is seaborne, though rail links to the Russian Far East and Mongolia are also important.
Fig. 5: Table showing coal exports from countries on the y-axis to countries on the x-axis; from the Statistical Review of World Energy, with color scale added for emphasis.
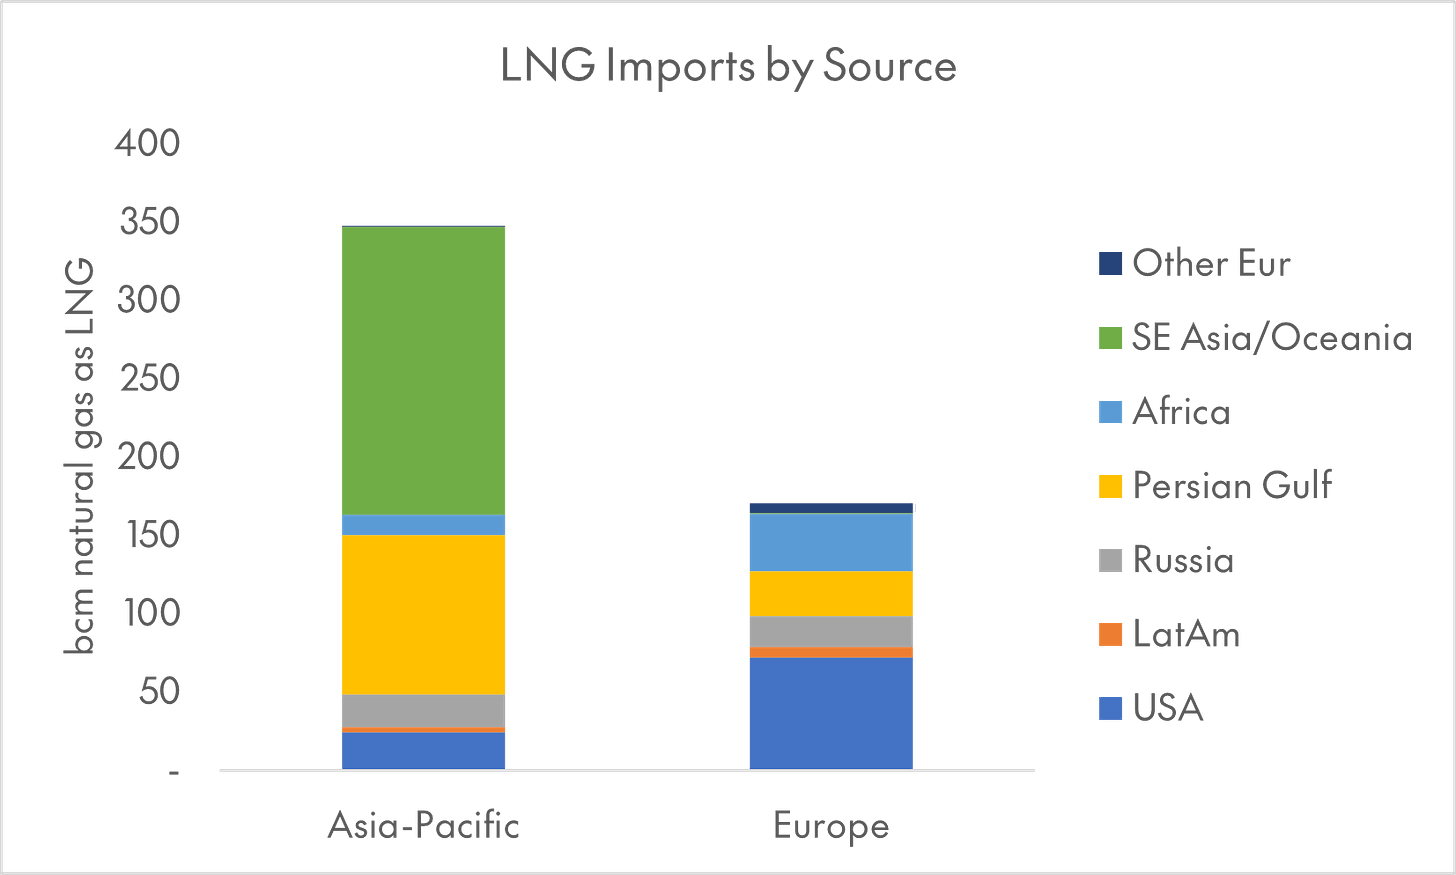
Trade in liquefied natural gas (LNG), which totaled around 13 percent of global natural gas production in 2022, is a bit more spatially distributed. Out of the 542 bcm in natural gas shipped this way, ~350 bcm (64 percent) ended up in Asia (particularly China, Japan, South Korea, and Taiwan), while ~170 bcm (31 percent) ended up in Europe. The most important LNG trade flows, by far, are from Southeast Asia and Oceania to East Asia (mirroring the story with coal), from the Persian Gulf to East Asia, and from the United States to Europe. These three trade routes make up two-thirds of global LNG shipments.
Fig. 6: The global LNG trade is driven by European and East Asian demand for gas from Southeast Asia / Oceania (especially Australia), the Persian Gulf (especially Qatar), and the United States. Australia, Qatar, and the US collectively export over 60 percent of the world’s LNG.
(Statistical Review of World Energy)
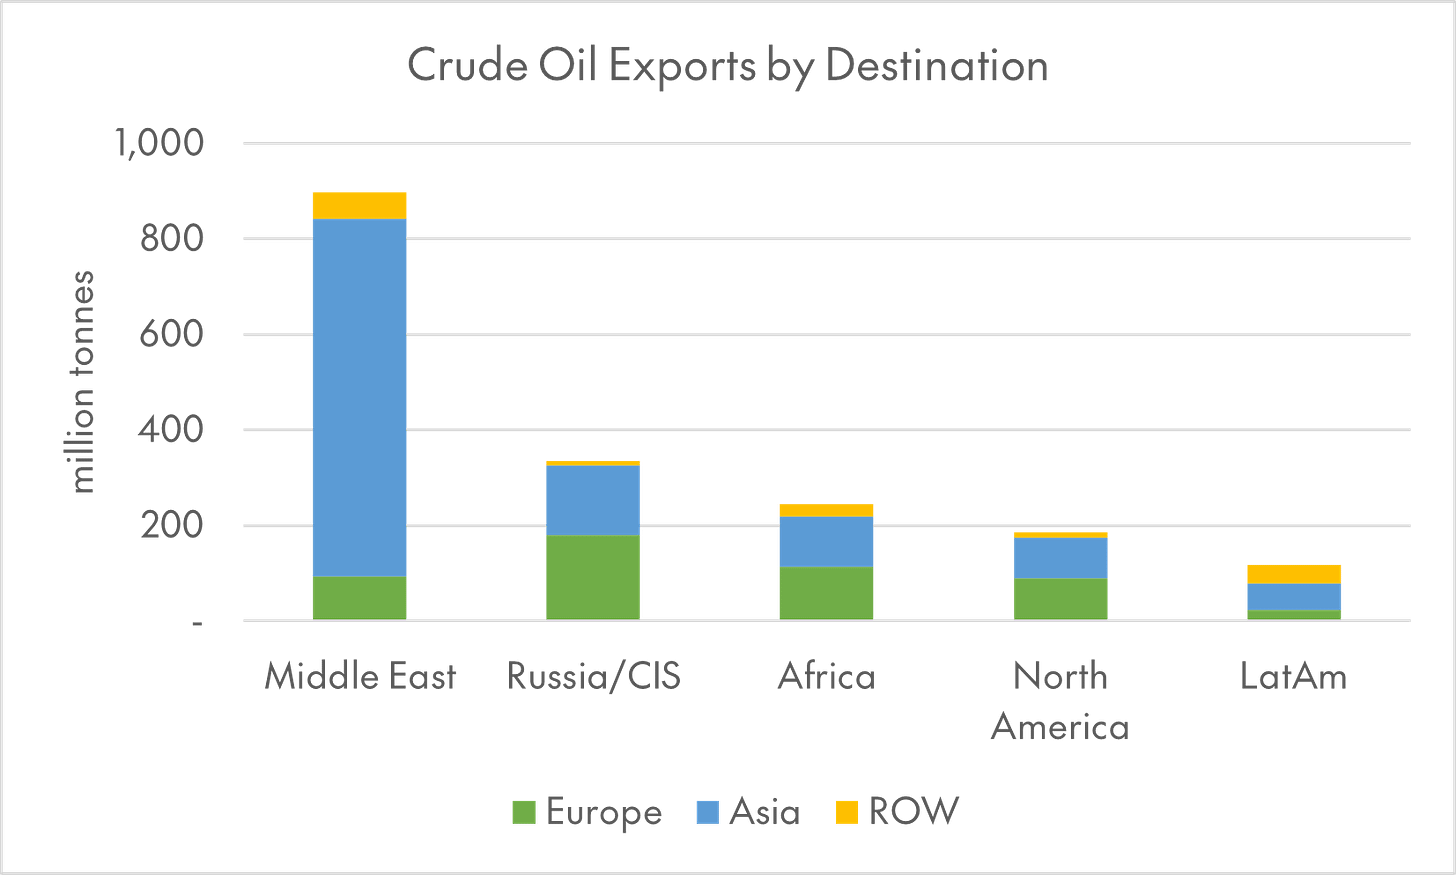
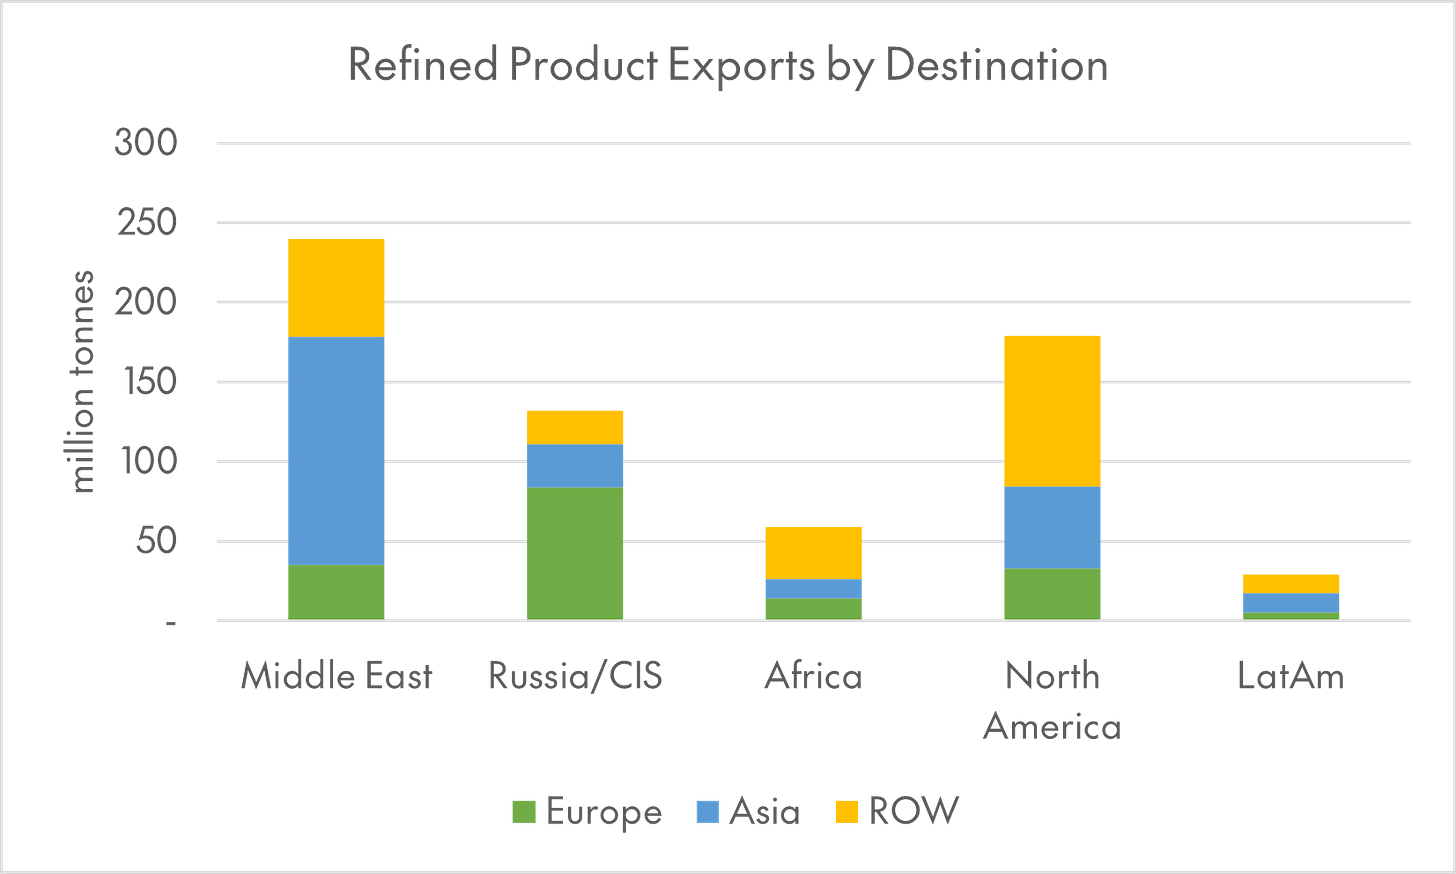
Summarizing trade in oil is more complicated still. By far the most important trade route for oil is from the Middle East to the Asia-Pacific region (~15 million barrels of oil per day in 2022). Outbound shipments from Russia and its neighbors (~6.6 mbo/d), Africa (~4.4 mbo/d), and North America (~3.5 mbo/d), split roughly evenly between cargoes bound for Europe and Asia, make up the rest. Refined product exports tell a broadly similar story, with a few quirks - Russian exports to Europe and North American exports (particularly to Latin America) are more important.
Fig. 7: Like Australasia in the coal and natural gas markets, the Middle East is responsible for an outsized share of global crude and refined product production, though Russia and its neighbors, Africa, and North America are also important suppliers, shipping oil to both Europe and Asia.
(Statistical Review of World Energy)
To oversimplify all of this - a majority of the world’s energy resources are traded internationally; trade in energy represents a large (though not overwhelming) share of overall global goods trade; and, finally, all three fossil fuels flow in a similar direction. That is to say, from a few energy-rich sources (Australasia, the Middle East, Russia, and North America) to the energy-hungry demand sinks of Europe and East Asia (and, to a much lesser extent, South Asia).
Getting even close to net zero over the next twenty-five years means restructuring these trade flows. The IEA’s Announced Pledges scenario (which, to be clear, envisions faster emissions reduction than the agency’s base case) seems to imply that inter-regional trade in oil, gas and coal could fall by 36 percent, 47 percent, and 80 percent, respectively (I’ve written about long-run energy forecasts here and here).3
To that point, I thought this BIS paper, from last May, was pretty interesting (emphasis mine):
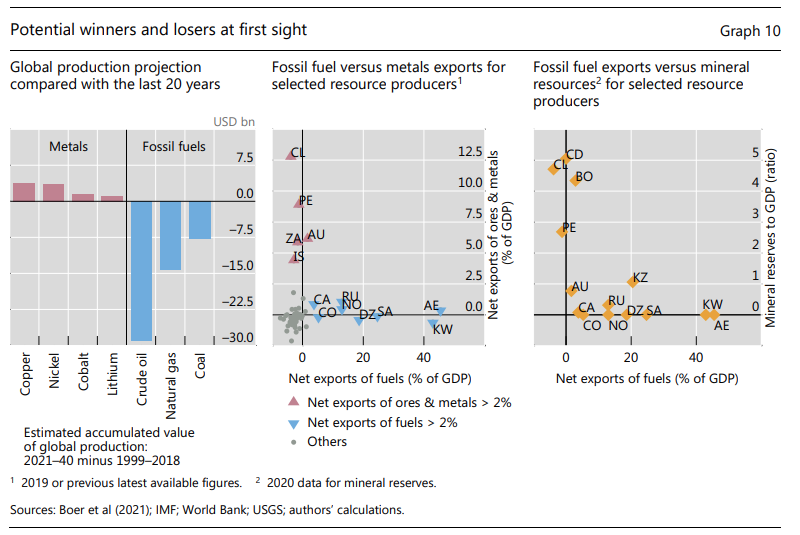
The transition may follow a variety of paths in the near-term. Constrained fossil fuel investment could push up energy prices sharply for an extended period and bottlenecks in metals and minerals markets could slow or raise the costs of the transition. But the opposite scenario is equally conceivable; rapid adoption or faster than expected improvement of clean technologies could push energy costs and fossil fuel demand down faster than anticipated. Metals and minerals production constraints could create a new commodity supercycle for the handful of countries where accessible reserves and refining capacity are concentrated (eg Argentina, Australia, Bolivia, Chile and Peru for reserves and China for refining).
The long-term picture may be as follows. Most of the world, particularly East and South Asia, should benefit from replacing expensive, polluting, imported fossil fuel with cheaper, cleaner, locally sourced energy. For major fossil fuel producers, especially those in the Middle East and North Africa, the economic benefits of clean energy will probably be overshadowed by the decline of existing energy sources.
Producers of key metals and minerals (eg copper, lithium, rare earths) should see amplified benefits, but the value of these exports will be substantially smaller than for fossil fuels. Overall, economic activity should shift from fossil fuel producers and towards energy importers and metals/minerals producers.
The piece is mostly exploratory, but the range of data the authors pull together, and the way they frame the basic problem of shifting energy geographies is impressive. The stakes for both commodity producers and users are enormous. For countries dependent on metals and mining (they use Chile and Peru as examples), the 2000s commodity super-cycle brought with it stronger exchange rates, higher real wages, and falling levels of government debt relative to GDP - all in sync with rising copper prices. For India, heavily dependent on imported energy, high oil prices are associated with a weaker current account balance, inflation, and higher borrowing costs.
Fig. 8: This BIS researchers’ screen for “winners and losers” among resource-exporting countries highlights just how different the geographies of fossil fuel and industrial metal production are.
(Bank of International Settlements)
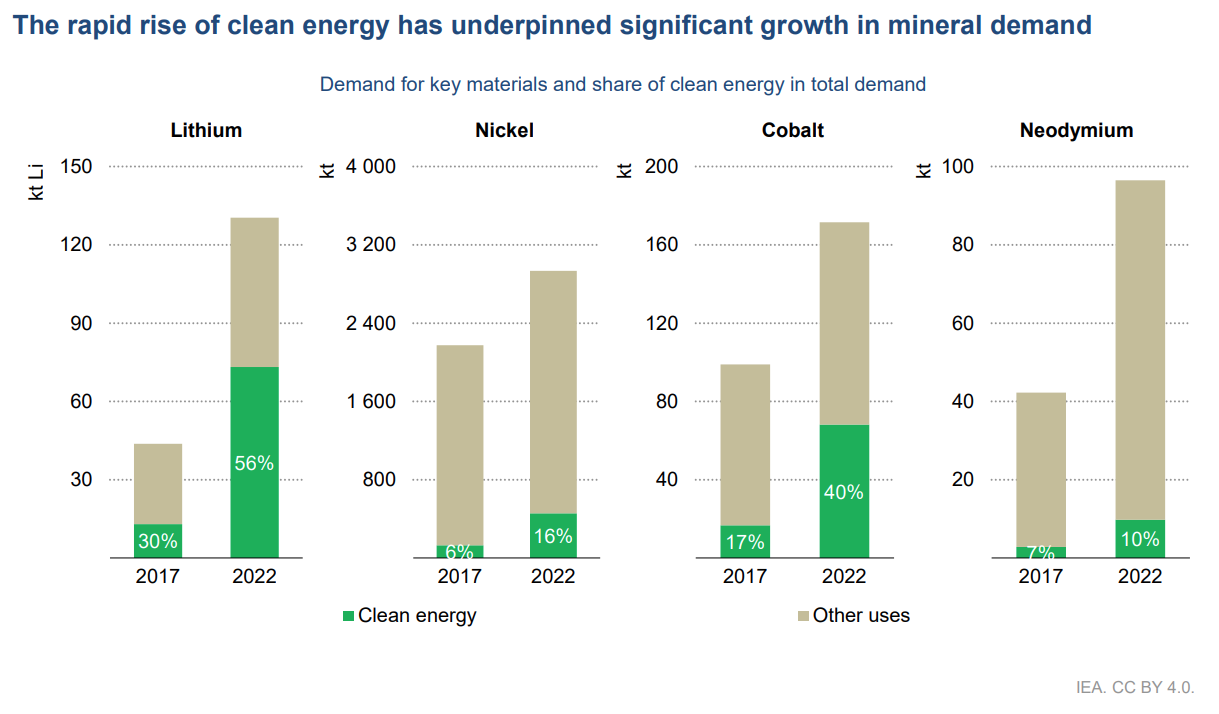
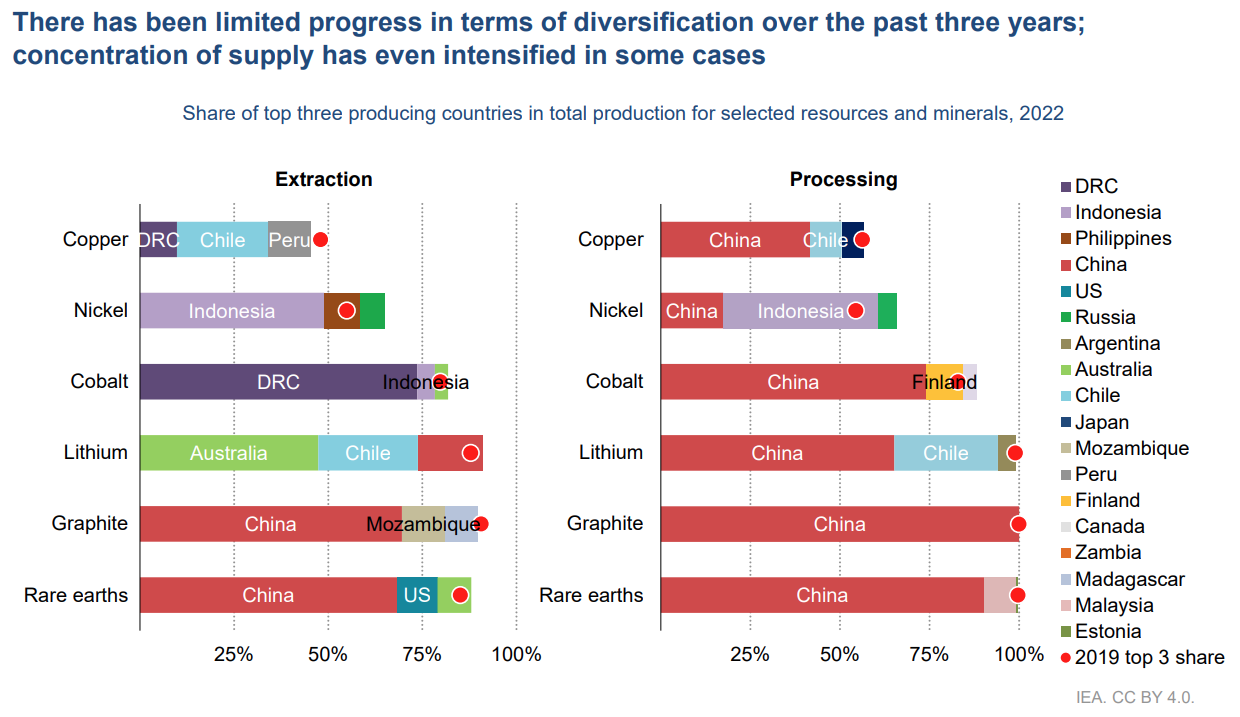
Demand for energy-transition related metals is set to grow, by a lot. Even in the IEA’s relatively conservative Stated Policies scenario, mineral requirements for clean tech ~double by 2050. In the agency’s Net Zero scenario, they more than triple. Both mining and processing are highly geographically concentrated (albeit mining a bit less so). China, obviously, also dominates global battery production (not to mention in other clean-energy value chains, like solar).
Figs. 9-10: IEA data shows that clean energy technologies are driving the increase in demand for lithium, nickel, and cobalt, and that processing capacity for these metals is heavily concentrated in China.
(International Energy Agency)
Broadly, OECD countries have reacted to these dynamics by incentivizing the domestic production of critical materials, framed in terms of “security of supply.” Resource-exporting countries have focused on moving downstream in the value chain, keeping more value-added for themselves.
Here’s a snippet from the IEA’s Critical Minerals Market Review to make this a little more concrete:
There is growing recognition that policy interventions are needed to ensure adequate and sustainable mineral supplies and the proliferation of such initiatives includes the European Union’s Critical Raw Materials (CRM) Act, the United States’ Inflation Reduction Act, Australia’s Critical Minerals Strategy and Canada’s Critical Minerals Strategy, among others. The IEA Critical Minerals Policy Tracker identified nearly 200 policies and regulations across the globe, with over 100 of these enacted in the past few years. Many of these interventions have implications for trade and investment, and some have included restrictions on import or export. Among resource-rich countries, Indonesia, Namibia and Zimbabwe have introduced measures to ban the export of unprocessed mineral ore. Globally, export restrictions on critical raw materials have seen a fivefold increase since 2009.
What does this all mean for corporates? For one, I think it requires a rethink of what “climate-related risks and opportunities” (to use the TCFD’s phrase) mean. In a world of carbon taxes and prices, it’s plausible to argue that “transition risk” is mainly borne by users of fossil fuels, and best measured in terms of emissions accounting. It is less clear what transition risk means, or who should worry about it, when “climate policy” is really industrial policy with a green watermark. Out with the carbon taxes, in with EV tax credits for cars with batteries that meet domestic content requirements. There are still lots of opportunities for companies and investors to balance positive climate impact and returns - but, in the brave new world of green industrial policy, they may show up in unexpected places.
Piecing together historical energy production, consumption, and trade flows is an extremely interesting rabbit hole, but one that is out of scope for this note. However, I was able to piece together data on historical fossil fuel production from The Shift’s data portal with the economic historian Paolo Malanima’s database of country- and region-level energy consumption from 1820 to 2020. I then calculated the supply-demand balances for “modern” energy (i.e. excluding draft animals, firewood, etc.) for the six largest industrial economies at the onset of the Second World War (the US, USSR, Britain, France, Germany, and Japan).
Two caveats apply here. First, these are different data sources, so I put more weight on the directional trend (energy consumption in the industrialized world growing faster than production) than on the exact level of the imbalance. Second, the Malanima data set only includes a breakout of energy consumption by source at the level of “macro-regions” (North America, Eastern Europe, Asia, etc.), not countries. Thus, to exclude energy from traditional sources at the country level, I used the share of “modern” energy in total consumption for the appropriate region, creating some fuzziness. This is especially problematic for Japan given its status as an outlier within Asia.
In the charts below, I use the same ratio of “modern” and “traditional” energy as in Eastern Europe (incl. the USSR) to adjust Japan’s energy consumption. Using the same ratio as in Western Europe (more “modern” energy, sooner) would slightly exaggerate the supply imbalance in the earlier part of the data set, and understates it in the later part. Using the same ratio as Asia as a whole would understate the supply imbalance over the entire period. But the main takeaway from the data would be unchanged - the industrial core of the world economy became much more dependent on external sources of energy as crude oil overtook coal in the postwar period.
I realized after writing this that it sounds a lot like the broad sketch of energy history Timothy Mitchell lays out in Carbon Democracy (relative to the industrial core, coal production close to home gives way to distant oil production).
This is a rough calculation - I proxy “inter-regional trade” by adding up total production of each commodity, minus local demand, in each of the broad regions (“North America,” “Eurasia,” etc.) that the IEA publishes detailed forecasts for in the latest World Energy Outlook.


