Energy dissensus
"Making predictions is hard, especially about the future"
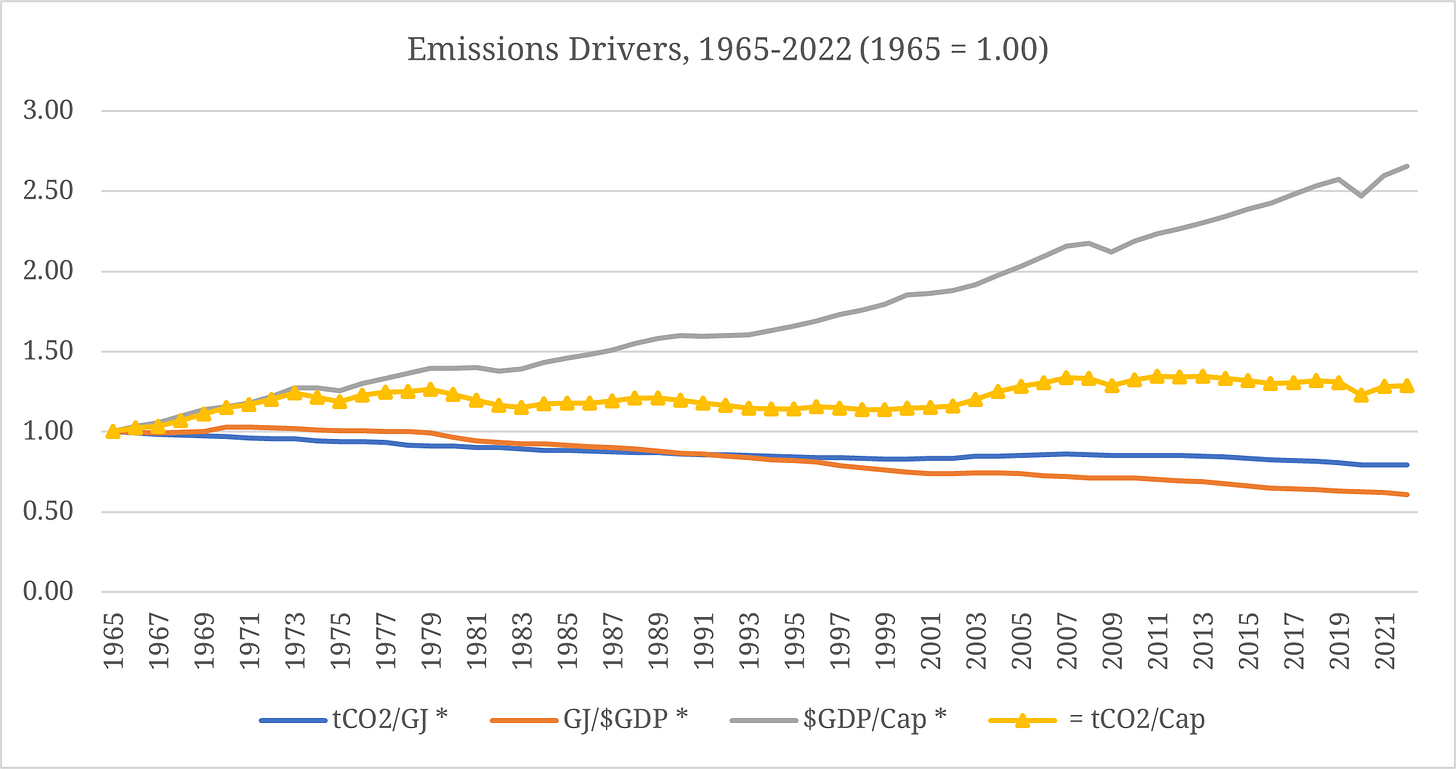
A common way of framing the energy history of the past fifty-odd years is in terms of exponential growth and ecological limits. Another way of framing it is that the world economy grew by ~6.4x, while the human population doubled, and that at the same time the energy intensity of the world economy fell a lot (by nearly 40%), and the emissions intensity of energy also fell (by around 20%).1
Said another way, if we needed the same amount of energy to generate a dollar of economic activity that we did in 1965, and we needed to burn the same amount of fossil fuels to produce it, global CO2 emissions would be approximately ~71 Gt – twice what they are today. This is pretty miraculous.
If you were to just extrapolate the linear trend in each of these drivers (i.e. population, GDP per capita, energy intensity of GDP, and emissions intensity of energy) roughly since the GFC, you’d expect CO2 emissions from energy to peak at ~35 GtCO2 in 2030, and to decline very modestly from there to 2050 (-11% in total, or -0.6% annually).
To be clear, this is still not great. It implies ~950 Gt of energy related CO2 emissions by mid-century, compared to a remaining carbon budget of about ~1,200 GtCO2 for a > 50% chance of keeping global warming to < 2°C above pre-industrial levels.
However, it does illustrate how going just one layer deeper into the underlying drivers of emissions paints a very different picture from simply anchoring on the historical growth of emission (about ~0.3 Gt of additional energy-related CO2 emissions per year since 2009, or ~0.4 Gt per year over the whole period from 1965-2022).
The point of walking through this very simple modeling exercise is to frame the proliferation of much more complicated and authoritative models, scenarios, and forecasts, that aim to address the same basic problem – how (i) emissions, (ii) energy use, and (iii) socio-economic variables will evolve over the next few decades, as governments around the world try to deliver on their net zero aspirations. Oil companies (see ExxonMobil, BP, and Shell), international organizations (OPEC and the IEA) and research firms (BNEF) all publish long-term energy outlooks that get at these questions.
Collectively, these projects help shape our conventional wisdom about the future – what the “base case” or “business as usual” we measure climate and energy policy proposals against looks like, and, alternatively, what a more aggressive path to net zero emissions might look like. Often, modelers bridge this gap by producing a range of “scenarios.”
Some scenarios aim to describe what is likely to happen (e.g. BP’s New Momentum scenario, which “is designed to capture the broad trajectory along which the global energy system is currently traveling”). Others are more speculative, and describe what could happen, often meaning what could happen under more aggressive climate policies (e.g. the IEA’s “Net Zero Emissions” scenario, which “maps out a transition pathway that would limit global warming to 1.5°C”).
The interesting thing about long-term energy modeling is that, as the cost of solar panels, wind turbines, and batteries have come down, and as countries around the world have implemented dramatic, supply-side climate policies aimed at promoting the growth of emissions-reduction-enabling industries, the gaps between long-term energy scenarios have widened a ton.
On the one hand, most of these scenarios now incorporate faster energy efficiency gains, and faster substitution away from fossil fuels over the long run. Compared to a decade ago, the latest edition of the IEA’s World Energy Outlook (WEO) projects 9% less primary energy demand, 18% less oil production, 15% less natural gas production, and 32% less coal production in 2030. The reduction in forecast energy use is coming from a lower assumption for real GDP growth (WEO 2013 assumed 3.6% growth from 2011-2035, vs. a 3.0% CAGR from 2010-2030 in WEO 2023), but the faster reduction in energy from fossil fuels reflect a real shift in expectations for the future energy mix.
Also interesting is the way that IEA estimates have pulled away from OPEC estimates over time. Here’s how each group’s forecast for 2030 oil demand has changed since the 2014 editions of the WEO and World Oil Outlook (WOO), respectively:
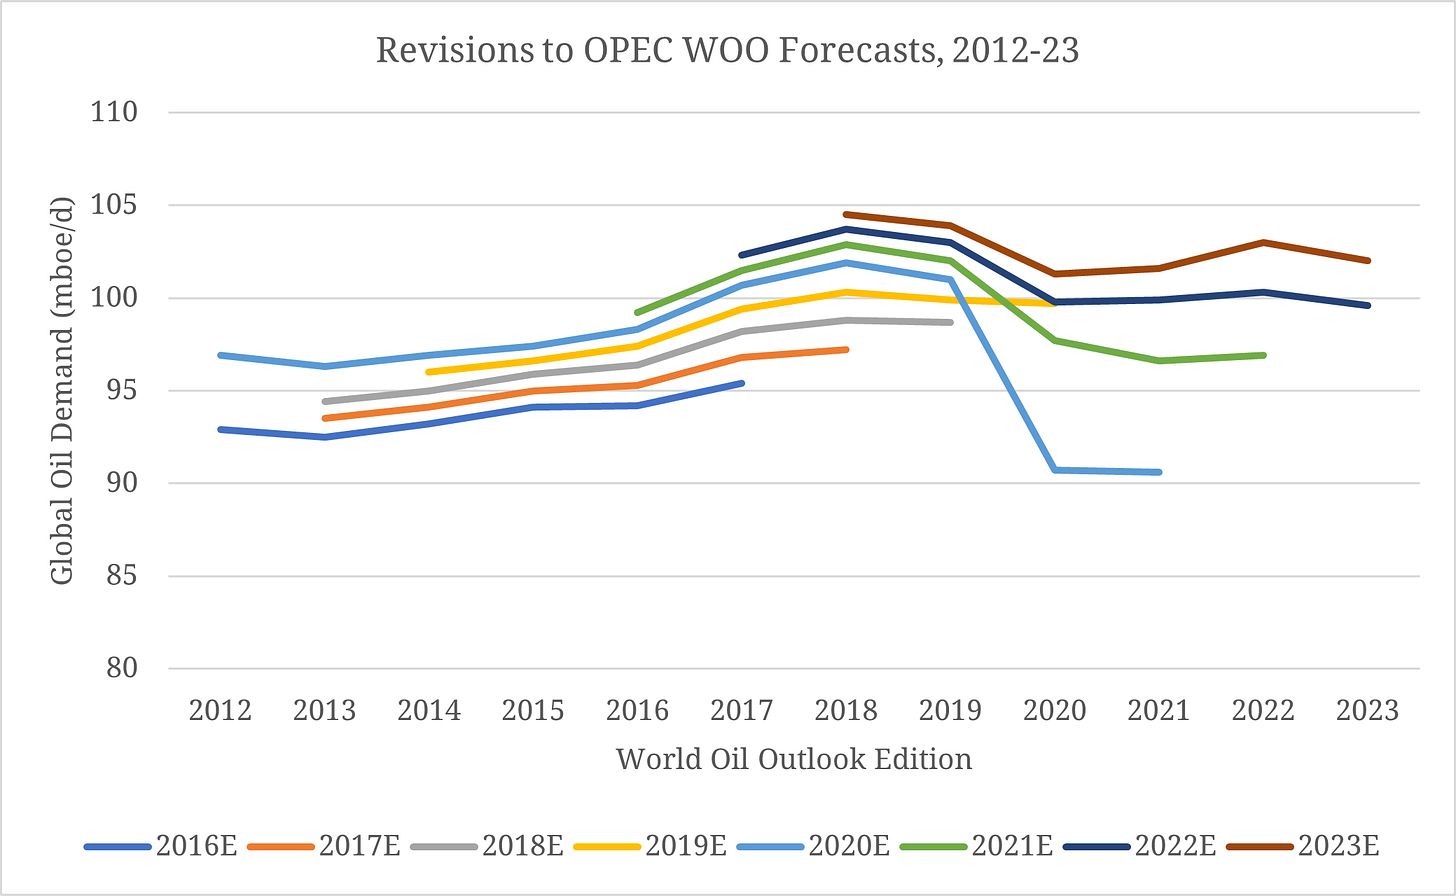
We will have to wait until 2030 to see who’s right here, though looking at how forecasters revise their estimates over time can be instructive. Throughout the 2010s, OPEC’s medium-term oil demand outlook erred on the side of conservatism. Over the five-year period leading up to 2016, OPEC revised its 2016 oil demand estimate up by 2.7%. The corresponding figures for 2017, 2018, and 2019 were +4.0%, +4.6%, and +3.9%, respectively.
2020 was obviously a big shock to the system, with demand 10% below the level predicted in the previous year’s edition of the WOO. But forecasts for 2021-23 also saw a downward drift as the years in question drew closer, falling -2.3%, -2.6%, and -2.4%, respectively, relative to estimates in earlier editions of the WOO. If, pre-pandemic, OPEC’s medium-term oil demand estimates proved to be a bit conservative, post-pandemic, they’ve proved to be a bit aggressive.
So what does all this mean? We live in a time of energy dissensus. Ideas about how the global energy system will evolve increasingly form the discursive “frame” for talking about political and economic futures. And our primary tools for thinking about a changing global energy system are not pointing to any one, clear, definitive answer.
Making sense of the debates around the “energy transition” requires keeping an eye on just how wide the range of possibilities really is – and updating one’s expectations as new cards keep turning over.
Energy and emissions per capita data is from the BP / Energy Institute Statistical Review of World Energy. GDP per capita data is in constant $2010 and is from the World Bank via FRED.


