Transition fuel (pt. 1)
Inaugurating an occasional series on the triumph of natural gas
The future of the global energy system is highly uncertain, but the future of some fuels and technologies is more uncertain than others.
This is the first in a series of notes digging into the recent past and future prospects of natural gas (made of nearly pure methane, or CH4). Used primarily as a fuel for the electric power sector, but also as a feedstock for the chemical industry, demand for gas is growing twice as fast as demand for crude oil and eight times as fast as demand for coal.
Looking at the median of six widely-followed energy outlooks (from the IEA, BNEF, and four oil & gas companies), gas appears likely to overtake coal as the second most widely used fossil fuel as early as 2030, and potentially even oil by 2045, when estimates call for primary energy from gas ranging from 132-181 EJ versus 152-190 EJ for oil.
BP’s forecast, which is both the most bullish on gas demand, and the most bearish on oil and coal, by a wide margin, implies that long-distance trade in oil will decline from nearly 40m barrels per day today to 30m by 2050, while long-haul trade in gas grows from nearly 600 bcm today to ~2,700 bcm by 2050. This leads to a striking result – that, at some time in the 2040s, trade in liquefied natural gas (LNG) will be larger, at least in energy terms, than inter-regional trade in crude oil.
A few observations anchor our view that understanding the political economy of natural gas is key to making sense of the energy transition as a whole:
Gas is energy-intensive, and therefore expensive, to transport, while global supplies are more concentrated than for thermal coal. This allows islands of high and low prices to persist. Gas prices in importing regions (Japan and Europe) have evolved from near-parity with prices in North America in the mid-2000s, to a 100-300% premium (or higher) in the wake of the shale revolution. Regional imbalances create large and persistent price signals, that, in turn, attract (potentially excessive) surges of investment in order to clear chokepoints – witness the huge slate of North American LNG facilities set to come online over the next five years. Relatedly, gas trade flows have also become a site of political struggle, with climate activists notching a recent win when they convinced the Biden Administration to delay approvals for new LNG export terminals. It’s interesting to read what someone like Bill McKibben has to say on this issue – plenty about the emissions impact of LNG, but also, curiously, on the prospect that more LNG export capacity would mean higher energy prices. The energy transition makes for strange bedfellows.
Gas is the only fossil fuel for which demand is expected to grow between now and 2050. Over time, the relative weight of gas in global trade and in remaining, not-yet-abated emissions will only grow.
Substitution of gas for coal drives down power sector emissions, but whether it is a cleaner fuel on a “lifecycle” basis is highly ambiguous – especially when it is transported as LNG. A recent working paper by Robert Howarth, for example, found that tanker transport of LNG from the United States can be 30-100% emissions-intensive than using locally produced coal. If imported gas is more expensive, less secure, and only better than burning coal on some environmental dimensions (less SO2, more GHGs), it is not so clear why global LNG demand will (or should) grow.
Gas infrastructure is a major “bridge” between possible fossil-intensive and lower-emissions energy systems. The emissions-reduction impact of gas (via avoided coal emissions) is also key for renewing oil and gas companies’ social and political “license to operate.” Shell’s latest LNG market outlook, published this morning, makes a lot of hay about gas complementing renewables by allowing a combination of low-capacity-factor resources (solar, wind, and, typically but not necessarily, gas) to replace coal baseload generation. But, more expansively, natural gas is a locus of the supermajors’ plans to win in “molecules” enabling the energy transition (as opposed to in “electrons”) – biomethane, blue hydrogen, “liquefied synthetic gas” – all of which can be seen as competing against other, potentially more promising emissions-reduction technologies for subsidies.
Green Gas? (Shell, February 2024)
“Molecules” vs. “Electrons” (ExxonMobil, April 2023)
In the rest of this note, I’ll focus on the role of natural gas in driving the “decoupling” of emissions and economic growth in much of the world – a role that complicates the usual optimism around the declining emissions intensity of GDP, both because of questions around the lifecycle emissions of natural gas, and because there’s limited headroom for the future emission reductions we can squeeze out of coal-to-gas substitution. Once you’re not burning any more coal, you’re still burning a heck of a lot of gas, after all.
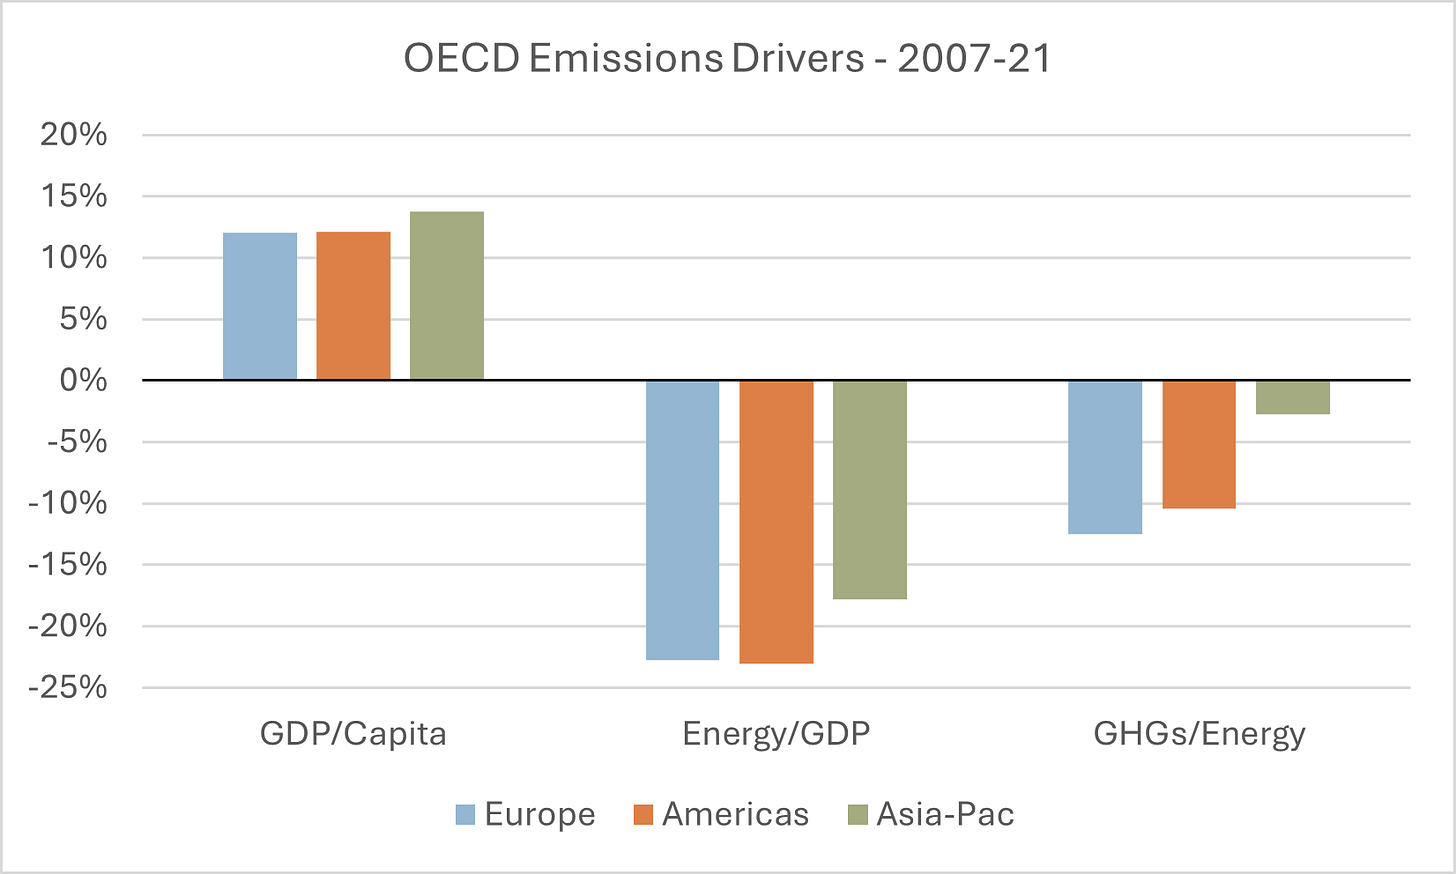
In the decade-plus since the GFC, emissions, energy use, and GDP started to diverge in parts of the world, and especially in the high-income countries that make up the OECD. As a matter of accounting, OECD GDP-per-capita managed to grow a bit in real terms, while the energy intensity of GDP and the emissions intensity of energy fell.
One might be tempted to think that the so-called decoupling is just a downstream impact of deindustrialization, with the wealthy countries of the OECD emitting just as much CO2 and CH4 as ever, but in the form of emissions embodied in imports from the developing world. However, consumption-based emissions, which attempt to adjust for trade, show a similar pattern of flattening or declining emissions in high-income countries.
That some form of decoupling is happening is relatively well-known, and a cornerstone of more optimistic takes on the energy transition. The fact that much of the world is already past peak emissions gives some observers confidence that decarbonization is possible, because getting to net zero just means intensifying current trends – decoupling even harder.
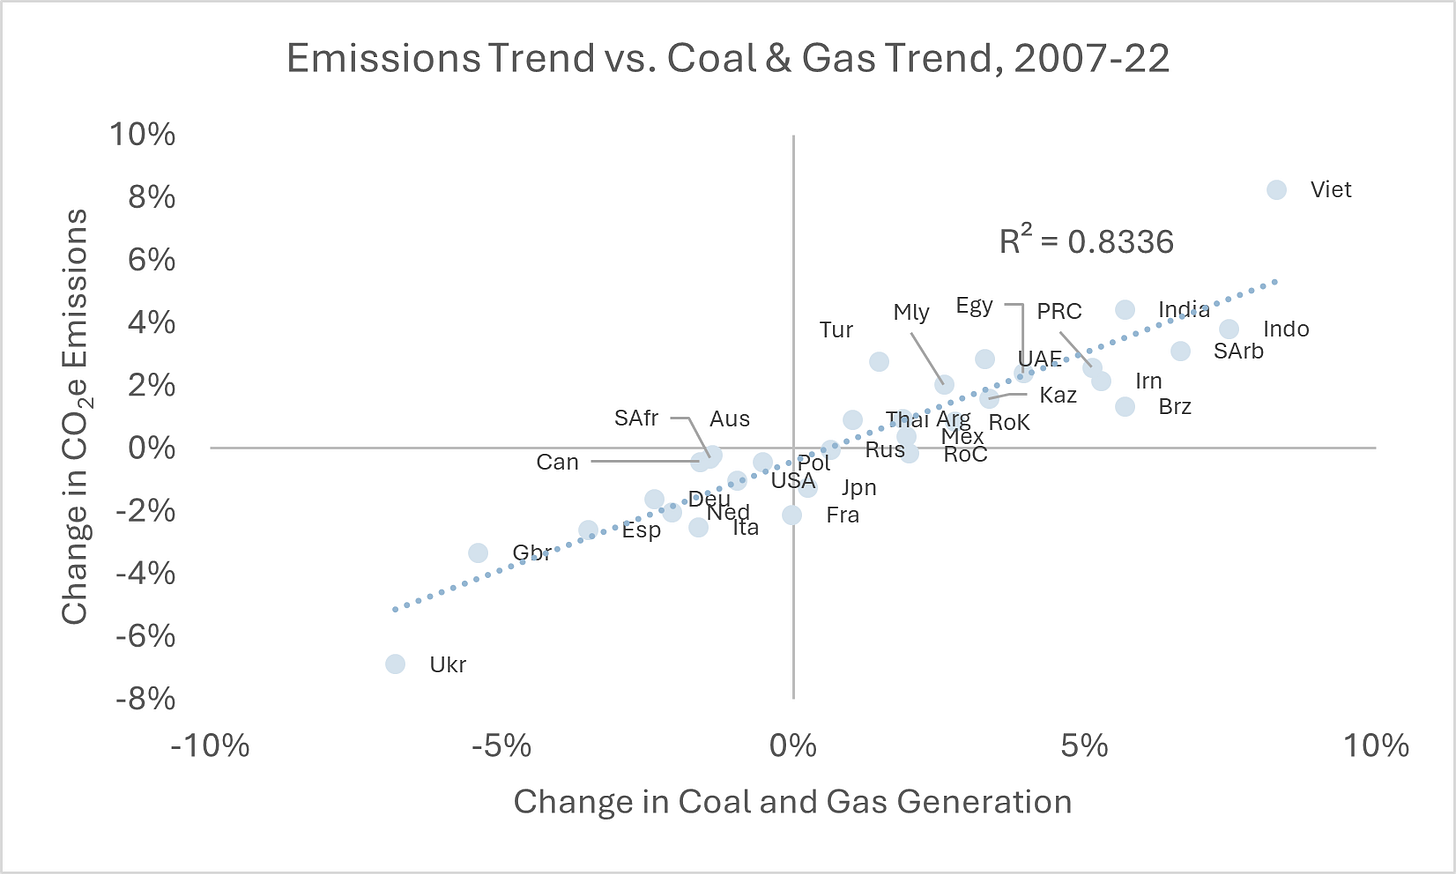
The electric power sector is the engine driving decoupling, as emissions from transportation fuels, heating/cogeneration, and various industrial processes have proven more difficult (more expensive) to abate. For a selection of countries covered in the Statistical Review of World Energy, emissions reduction over the period from 2007-22 is strongly correlated with change in electric power generation from coal and natural gas.
What is slightly less obvious is that, since 2007-08, the changing mix of fuels within the fossil energy category has played almost as big a role in bending the emissions curve downward as the deployment of renewables. This will likely change in the future, as gas generator capacity additions slow while solar and wind additions accelerate1, but it is key to understanding why emissions and GDP decoupled in the ZIRP era – not just because of subsidy-driven learning in solar, wind, and batteries, but also because gas displaced coal as the workhorse fuel for electric grids in high-income countries.2
Between 1990 and 2021, the emissions intensity of electricity in the OECD fell from 590 kt of CO2e per TWh of electricity to 391 kt / TWh, a 34% reduction. Absent this change, (i) annual OECD emissions would be ~1.7 Gt higher than they are today, and (ii) the magnitude of the OECD emissions decoupling would be about ~2/3 smaller than in reality, with annual emissions falling by ~0.4% per year from 2007 onward, versus ~1.2% in reality.
From 2007 to 2022, the OECD added 1,541 TWh of solar and wind generation. Assuming this displaced an equivalent amount of fossil generation, at an average emissions intensity of 804 kt / TWh, the deployment of solar and wind power helped avoid ~1.2 Gt of annual emissions (though this calculation is skewed in solar and wind’s favor, since it doesn’t include lifecycle emissions or emissions from firming resources). Assuming it displaced an equivalent amount of new-build gas capacity, at an average emissions intensity of 403 kt / TWh3, the avoided emissions would be more modest, at ~620 MT.
Over the same time period, gas generation increased by about 1,020 TWh. Assuming this primarily displaced coal generation, at an average emissions intensity of 950 kt / TWh, incremental power from natural gas avoided ~560 MT of annual emissions. The point is less the exact outputs of the exercise, which should be taken as illustrative, but that under plausible assumptions (new gas plants allow coal to be retired; new renewable resources avoid adding additional gas capacity), the “avoided emissions” impact of gas has been comparable to that of variable renewables.
Two simple conclusions jump out from this analysis:
First, that while the OECD would still be “decoupling” without the rapid expansion of natural gas, it would be decoupling a lot more slowly. Because this is a lever you can only pull once (eventually you run out of coal generation to replace), the degree of acceleration in emissions reduction required for high-income countries to reach net zero is higher, not lower, than it appears at a glance.
Second, it’s impossible to analyze the drivers of emissions reduction without foregrounding the relationship between supply and demand for key fossil fuels. Gas was able to replace coal not just because of tougher air quality standards, but also because the rapid expansion of gas supplies in the wake of the fracking boom rapidly reduced the marginal cost of gas-powered electricity, from a substantial premium to coal to parity (at least in the US).
In deregulated electricity markets, where plants are dispatched in increasing order of marginal cost, this dynamic can set off a powerful feedback loop. As supply of gas goes up (due to a huge and often uneconomic increase in investment), prices go down, and the capacity factor of coal plants goes down, raising the breakeven cost of electricity generated from coal. Regulation has had a big role to play in driving coal plant retirements across the OECD, but one that continues to be mediated by the economics of power markets and natural resource extraction.
Further Reading:
BloombergNEF, New Energy Outlook 2022 (2023)
BP, Energy Outlook (2023)
Energy Institute, Statistical Review of World Energy (2023)
Equinor, Energy Perspectives (2023)
ExxonMobil, Global Outlook (2023)
International Energy Agency, World Energy Outlook (2023)
OECD, OECD.stat (Various)
Shell, LNG Outlook (2024)
US Energy Information Agency, Electricity Data Browser (Various)
For example, according to the 12/2023 edition of the EIA’s Electric Generator Monthly, just 17 GW of new gas capacity is in the works in the US, versus 85 GW of solar and 28 GW of wind. If anything, this comparison is biased in gas’s favor, given the longer lead time associated with gas plants, e.g. 40-42 months before COD vs. 21-36 months.
The chart below includes data from a subset of OECD countries for which detailed historical generation data is available in the Statistical Review of World Energy. Since the early 1990s, these countries have represented 90-91% of total OECD emissions. When I refer to “OECD emissions” in this piece, I am referring to this large (but not quite complete) subset of the OECD.
Based on a typical combined-cycle gas plant heat rate of ~7,600 btu / KWh and 2022 EPA emissions factors for natural gas.


