Is the turbine cycle turning?
Secular trend, meet cyclical industry
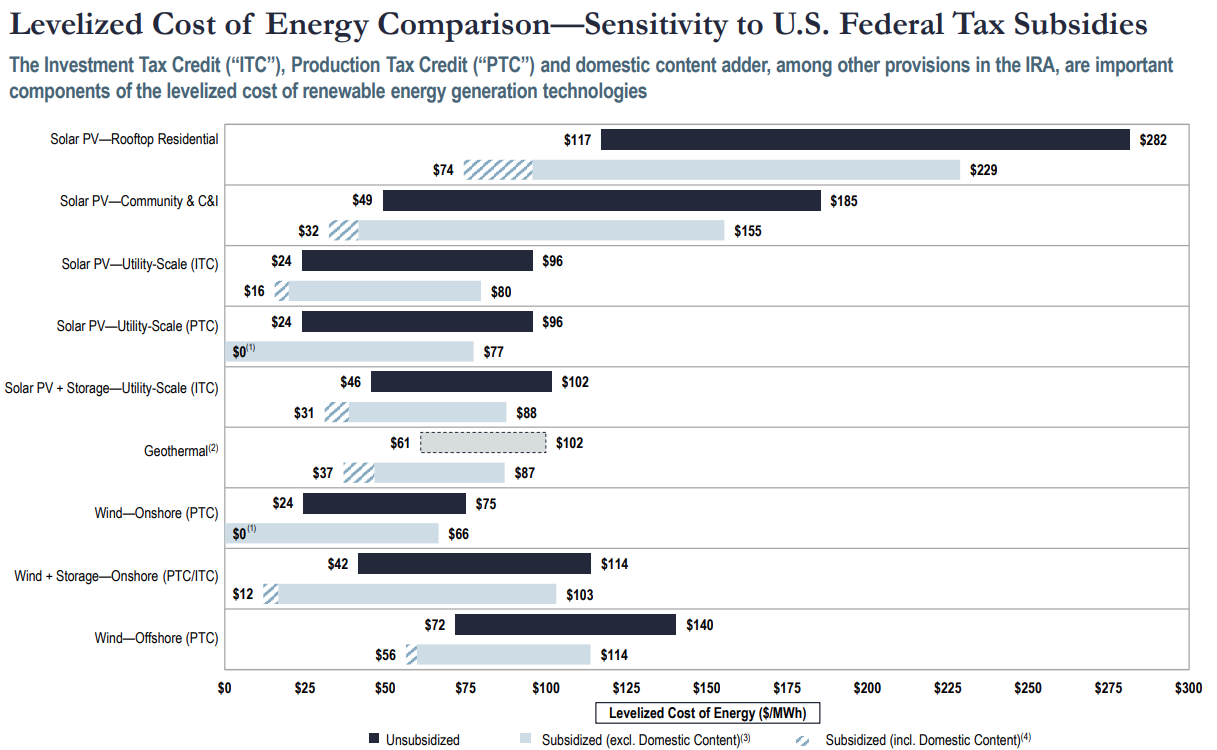
Renewable power sources have a marginal cost of nearly zero, but cost a lot to build and finance. Power from fossil fuels does have a marginal cost - $20 or so worth of coal or gas per MWh, based on recent US prices, plus the cost of running a big plant.1 Levelized cost of energy (LCOE) - which I’ve written about previously - is a metric for comparing these different power sources, which supply the same commodity (MWh of electricity) with very different cost structures.
(Lazard)
Calculating levelized costs involves lots of assumptions, which range from inputs that it’s easy to find an up-to-date, arm’s-length cost for (like fuel), to variables that it’s possible to represent with a national average or an idealized example project, like construction costs, all the way up to drivers that require more arbitrary assumptions, like the “cost” (i.e. required rate of return) of equity financing.
Generally, analysts will assume that the sponsors of a renewable equity project require an 8 to 12 percent rate of return. For example, Lazard’s power and utilities bankers use a base-case 12 percent cost of equity in their ~annual LCOE report. This range is defensible. The Capital Assets Pricing Model (CAPM) is a somewhat academic approach to calculating the cost of capital, but it’s still useful as a sanity check (and to explore embedded assumptions). Adjusting Aswath Damodaran’s data on the cost of equity for utilities, if 60 to 80 percent of the cost of a solar or wind project is funded with debt, I get to pretty much the same range (8.2 to 11.6 percent). If anything, this range may be too high for a de-risked project with locked-in, contractual revenue.
The interesting wrinkle is that in levelized cost analysis, we assume that the project we’re modeling earns an appropriate rate of return (commensurate with the sponsor’s level of risk). But any kind of power plant project requires all sorts of inputs from suppliers that operate in capital-intensive and often brutally competitive industries. Like all cyclical businesses, these suppliers are faced with the basic problem of lags in matching supply and demand. Prices can surge higher, incentivizing producers to expand capacity, only for “too much” production capacity to come online. Because of the one-way nature of the investments, new entrants end up dumping output at its marginal cost. If they’re lucky, higher-cost suppliers exit and demand eventually grows enough to absorb the excess capacity (maybe spurred on by rapidly falling prices) - and the cycle begins again.
Where these dynamics come to a head is in the way they affect the cost structures of a fossil fuel or renewable power plant. For the operator of a fossil plant, where variable costs may be 40 percent or more of the cost of power, the changing cost of fuel can be at least partly passed on to customers. If costs rise, the fossil plant’s owner will bid in to the power market at a higher price, essentially refusing to supply power until prices rise enough to make it profitable. Renewable developers have a different problem. They buy what I think of as “green capital goods” - wind turbines, solar panels, inverters - and crystallize their current prices over the twenty year life of the project.
In short, when we look at levelized costs for renewables (or any other energy source), we are almost always assuming a “normalized” level of profitability for the developer. But the input cost assumptions involve all kinds of embedded assumptions, including, obviously, construction costs. When we compute the cost of power using solar panel prices that indicate acute scarcity, like in the late 2000s, we’re likely to be too bearish. When we use costs for wind turbines that are below breakeven for suppliers (more on that in a second), we risk being too bullish.
The wave of investment in thermal solar power in the late 2000s was driven by surging polysilicon prices, a key input to photovoltaic (PV) solar panels, and ended up becoming a historical footnote because of the scale of the supply response:
We’ve touched on these issues in previous work on offshore wind, but they apply to onshore wind as well. Wind turbines make up around half of the overall cost of wind power (before accounting for tax benefits), or around two thirds including associated financing costs.
(CAS modeling; please reach out for Excel)
In the US, essentially all wind turbines are manufactured by four Western companies: General Electric, Denmark’s Vestas, and two Spanish-German companies (the product of mergers), Siemens Gamesa and Nordex Acciona, Globally, the industry appears more competitive. BNEF estimates that the four Western players made up just 26 percent of turbine installations in 2023, down from 48 percent five years ago.
(DOE Wind Technologies Office)
The main thing about the wind turbine industry is how much money everyone in it has been losing. Here is a ten year view of Vestas’s revenue:
Operating profit:
And return on capital employed (ROCE):
Not a pretty picture. And the story is similar for Vestas’s competitors. Here are operating margins for Vestas, Siemens Gamesa, and Nordex going back to 2008.
(DOE Wind Technologies Office; trailing 12-month total for Nordex)
An important dynamic here is that “sales” for these companies reflect deliveries (“transfer of risk” in accounting terms) of turbines potentially ordered years ago. Vestas, for example, has an onshore wind turbine backlog totaling over two years’ worth of annual deliveries. Over the last several years, turbine manufacturers have been recognizing revenue from deals struck at the peak of industry competitiveness, while costs increasingly reflect the inflationary backdrop of the 2021-to-2023 period. Gross profit per turbine evaporated, with revenue from service contracts left as the only reliable source of earnings.
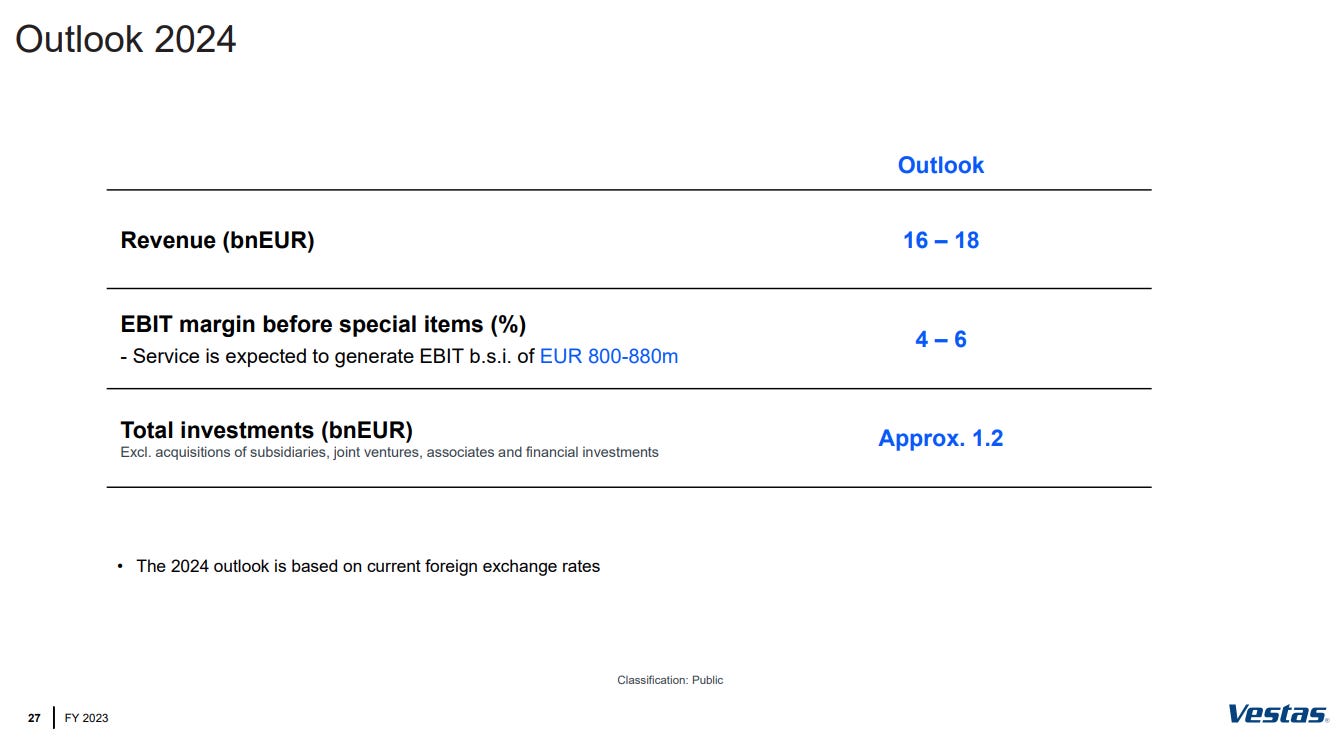
Looking ahead, however, all these manufacturers are signaling a recovery in margins, buoyed by higher pricing. In the context of a Western market largely shut to Chinese competition, with installations continuing to grow (IEA predicts wind generation in North America and Europe alone will more than double from 2022 to 2030), guidance like this reads as a plea for a return to more disciplined, oligopolistic pricing.
(Vestas, GE, Siemens Energy)
It also implies more expensive wind power. In Vestas’s case, the midpoint of guidance implies pricing growth of flat-to-ten percent on delivered turbines, depending on volumes.2 That’s an increase the market can certainly bear, at least for now - wind power purchase agreement (PPA) prices have already been rising for several years, and are now above either Lazard’s LCOE estimate or ours.
For a maturing technology like wind, year over year trends in costs are no longer driven by an idealized process of “learning,” but rather by the gales of creative destruction (Schumpeter) endemic to any capital intensive industry. The secular trend of decarbonization is enabled by the ups and downs of the highly cyclical industries selling green capital goods - some turbulence is to be expected.
Hard to peg exactly where this will land. Vestas saw a surge of orders in Q4 that completely broke the book-to-bill ratio (around ~1.1x in recent years) and backlog-to-delivery ratio (now around 2.0x vs. 1.5x or lower in prior quarters), while talking up average selling price (ASP) trajectory on its earnings call (consistent with reported new order prices):
Under competitive landscape we have taken orders. We are happy to take the orders we have taken and we are definitely very happy with the ASP we've also seen in Q4. And we are taking them in countries and in markets where we feel we are strong and where customers want to have our solutions then I will avoid commenting on competitive decisions or where they are strong or weaker. I think that goes entirely to their conference and analyst calls. (CEO Hendrik Anderson)


