What exactly do we mean by "falling costs"?
Unpacking the LCOE of renewables
I.
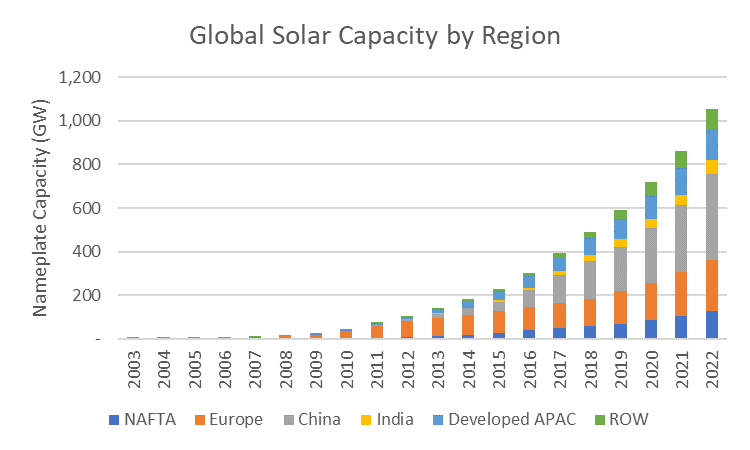
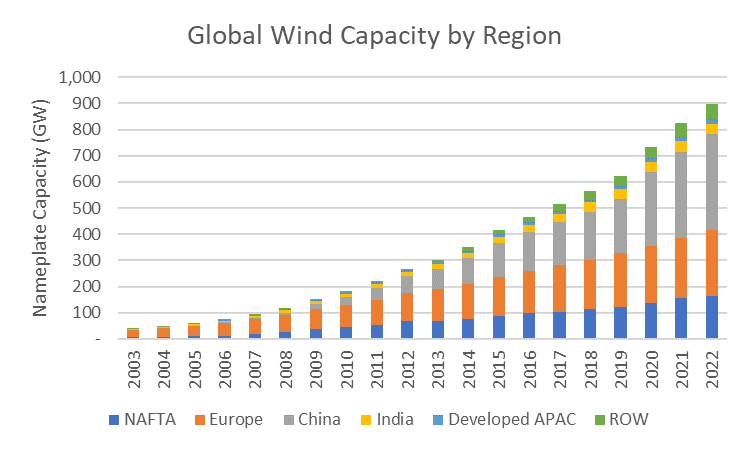
Over the last decade-plus, a massive amount of solar and wind power capacity was installed globally. Solar photovoltaic (PV) capacity grew literally 500-fold from 2003-22, with annual growth rates still ranging in the low-20s over the last five years. Wind, which had a ten-year head start, grew 20-fold over the same period and is still growing about 10% per year.
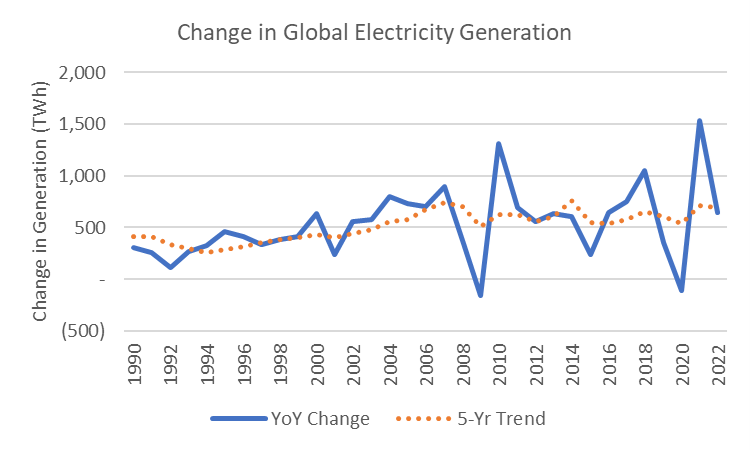
These “intermittent” renewables (so called because they generate power when the sun is out or the wind’s blowing, not when they’re switched on) delivered about 12% of the world’s electricity last year. They’re now at a scale where the annual roll-out of solar panels and wind turbines is almost enough to offset the world’s thirst for power, which currently grows by about ~700 TWh per year (admittedly very lumpy in recent years), which is about ~2.5% annually (quite a bit faster than world population growth, just shy of 1% a year).
Data: EI Statistical Review of World Energy, 2023
II.
It’s worth rehashing some of the high level trends in renewable deployment over the past twenty years, and especially over the past ten. The growth of solar and wind energy is remarkable in its own right, and, just as importantly the recent past tends to furnish the raw material for causal storytelling about the near future.[1]
Right now, that storytelling tends to center the interplay of “push” factors that are driving down the cost of solar and wind, rather than the “pull” factors that subsidized these technologies at an earlier phase of their growth. A recent Nature Communications paper argued that solar has already passed a “global irreversible tipping point” in adoption, and that as the price of building and installing solar panels continues to fall, it will become the dominant source of electric power globally. Citing that paper, and the latest edition of the IEA’s World Energy Outlook, the NYT’s Manuela Andreoni wrote last week that “the example of solar shows that market forces can be powerful in their own right” in achieving emissions goals.
An underlying idea here – one, I should add, that makes a lot of sense, and that is probably the best first-approximation model of how this stuff works – is that the adoption of technologies that enable emissions reduction is primarily driven by cost, and that low-carbon widgets of various kinds can displace high-carbon widgets as they reach cost-competitiveness with the incumbent technologies.
A closely related idea is that this means policymakers can use relatively cheap “carrots” to initiate snowballing cost reduction in new technologies, which soon enough are able to get by without government support. Another is that the kind of dramatic cost reductions that have characterized solar and wind can be extrapolated to lots of other technologies, whether carbon capture or heat pumps or small modular nuclear reactors, that, depending on which decarbonization roadmap you consult, will play a more or less important role in reducing global emissions.[2]
There’s a lot to unpack here, particularly on the applicability of wind and solar as a model for (often quite different) technology, particularly technologies best deployed in the form of site-specific mega-projects rather than relatively small, standardized installations using standardized components (traditionally, people talk about conventional light-water nuclear reactors as an example of the former, but a lot of midstream and storage infrastructure for all kinds of new energy technologies could plausibly fall into this bucket, especially early on).
III.
But before we get ahead of ourselves, it’s best to ask a naïve question – what exactly are we talking about when we talk about the “falling cost” of renewables?
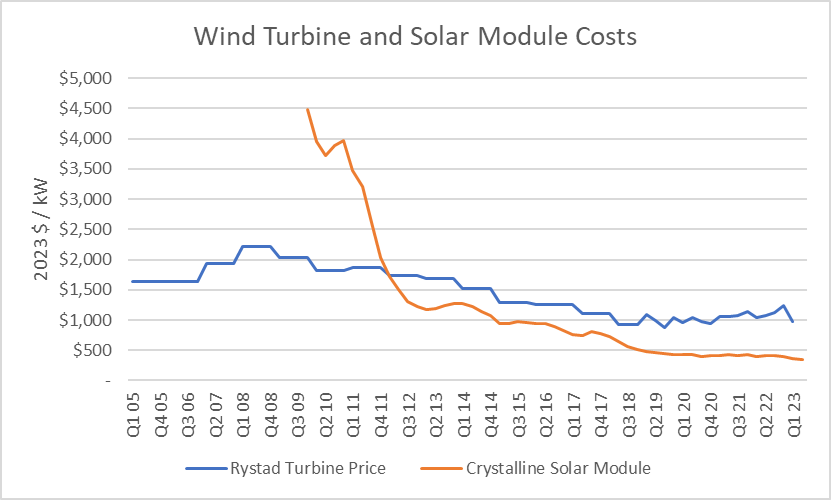
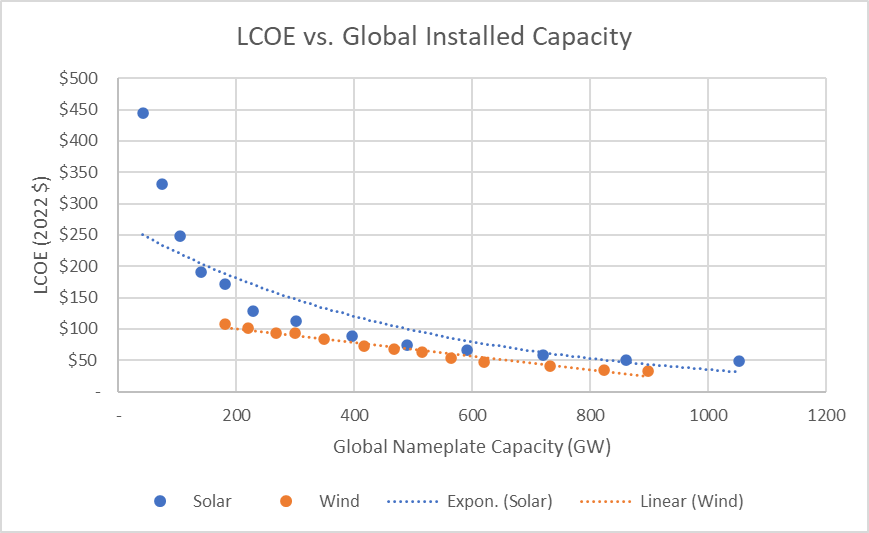
The answer is a little less obvious than it would appear at first blush. Certainly, the price of the key components in solar and wind power plants – turbines, solar modules, etc. – has declined at an impressive rate:
Data: IRENA Renewable Power Generation Costs, 2022
But the “costs” invoked in the Nature Communications paper, and, indeed, in a lot of energy and climate discourse, aren’t the costs of buying a solar panel or a wind turbine, and nor are they the costs of concluding a power purchase agreement with the developer of a new renewable energy project, though they are related to both these metrics. Rather, they’re the “levelized cost(s) of energy” (LCOE) of specific technologies, which are the output of a cash flow model that back-solves for the price of power required to earn a targeted return for investors in a project.
To unpack that notion a little farther, it’s best to frame it in terms of standard financial analysis, where you might start with assumptions about prices, production volumes, and costs, in order to track how those inputs flow through the model and drive a particular financial outcome. LCOE models flow in the opposite direction – starting with assumptions about the cost of debt and the hurdle rate required by equity investors, and deriving whatever constant price of power allows for the debt to be repaid and the equity investors to earn a minimum rate of return.
The value of LCOE is that it can be used to compare electric generators with high up-front costs, but minimal operating and maintenance (“O&M”) costs and zero fuel costs (renewables) to generators with substantial O&M and fuel costs (thermal plants). Equations for deriving LCOE can look a little simplistic, but often embed quite detailed assumptions for the capital cost of a new plant (ideally informed by an engineering consultant’s estimates), the tax-shielding impact of accelerated depreciation (a crucial and overlooked driver of the profitability of renewables), plant capacity utilization, and the like:
Image: NREL ATB, 2023
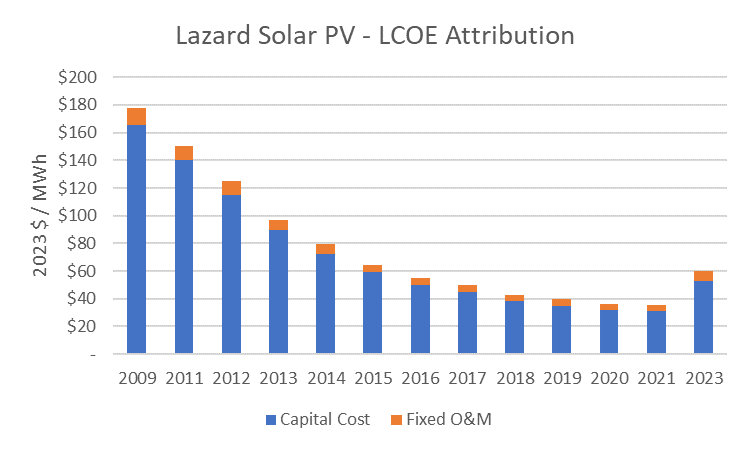
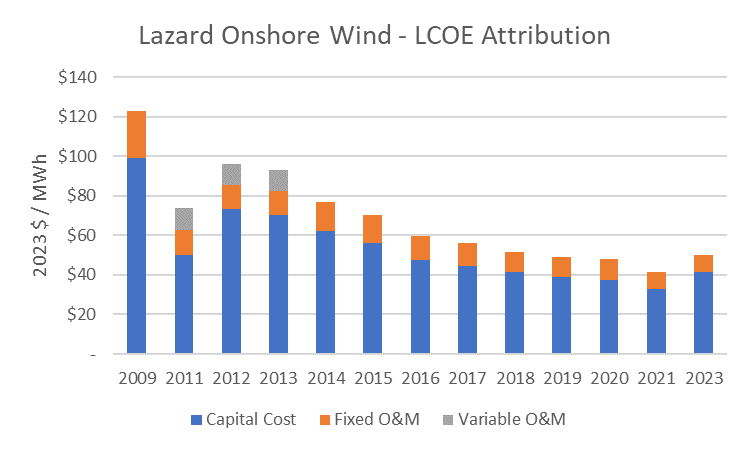
For renewables, nearly all of the cost of electricity is driven by buying and installing the key components of the power plant itself, as a breakdown of Lazard’s widely-quoted annual LCOE reports shows.
Data: Lazard, April 2023
IV.
One major nuance that’s worth dwelling on is that these capital costs are not really just “capital costs,” in the sense of, say, initial capital expenditure straight-line depreciated, or divided by lifetime generation. They include both those costs and what is better captured by the label “financing costs,” i.e. servicing debt and enabling equity investors to recover their capital.
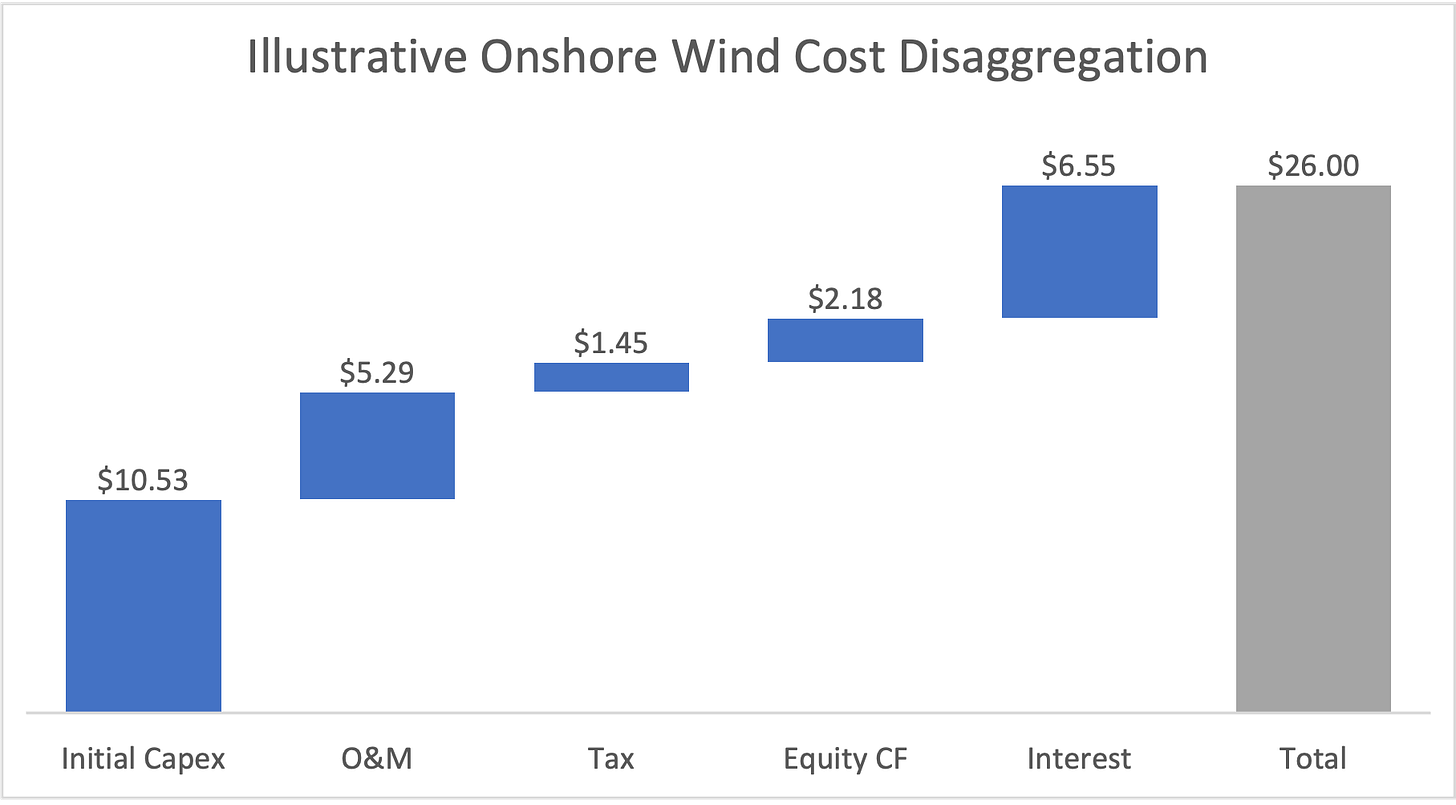
For example, if you break down an illustrative LCOE calculation for onshore wind ($26/MWh), you might find that about $21 of that cost is “capital cost,” and about $5 is “operating and maintenance.”
But if you open the hood a bit, the story gets a little more interesting – another way to present the analysis is that about ~60% of the cost of wind power (again, illustratively!) is made up of what I am tempted to call “real” costs, i.e. stuff that has well-established arm’s-length prices, which in some cases, e.g. for different solar components, can literally be pulled up on Bloomberg, and in other cases can be grounded in detailed public documents, like the “Capital Cost Study” used by the EIA to inform its Annual Energy Outlook analysis.
The rest is, for lack of a better term, black-boxey, given that it’s driven by things like the internal hurdle rate used by infrastructure investors, and the underwriting criteria of the French and Japanese banks that dominate the global project finance market, which are likely to be pretty situational and, in any event, hard to ascertain from public information.
V.
However, digging into the sensitivity of renewable energy costs to (i) what’s going on in capital markets, (ii) subsidies (including sub-national subsidies, which it can be harder to gather systematic information on), and (iii) taxes (which are decisively shaped by systems like MACRS that ultimately exist to stimulate capital investment in general and are not usually thought of as energy policy) is a topic for another day.
This is because, as the above chart showing falling solar module and wind turbine prices illustrates, the drivers of falling solar and wind costs really have been “technical,” driven by declining costs of key components and improved performance, respectively.
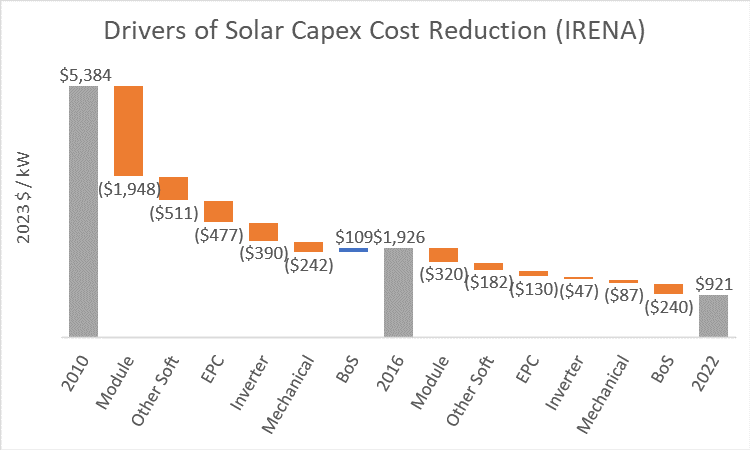
An interesting and somewhat under-discussed dynamic with solar is that all of the major components of the solar cost structure have seen remarkable reductions in cost, not just modules and inverters, where Chinese firms dominate the market (and in the case of modules, where excess capacity has been a chronic issue).
Data: IRENA
Generally, cost declines for wind have been more linear than solar, and, based on IRENA data, increased capacity factors have played a larger role in the cumulative cost reduction that’s taken place since 2010, driving almost 10% of the total cost-down versus just 1% for solar.
Parting Thoughts
LCOE is an extremely valuable analytical tool. That said, users should approach it with eyes wide open. In particular, the LCOE of any project is going to be fairly sensitive to the ups and downs of capital markets (i.e. how much financing is available, and on what terms) – perhaps 30-50% of the calculated LCOE for a given project, to put a rough range around it.
Massive cost reductions have driven large-scale adoption of solar and wind power. But the long-term trajectory of solar costs doesn’t even look that much like the trajectory of costs for wind (which has been much more linear), let alone more nascent (and fundamentally different) low-carbon technologies. Caution is warranted on “overfitting” our expectations about the future onto the recent history of solar energy.
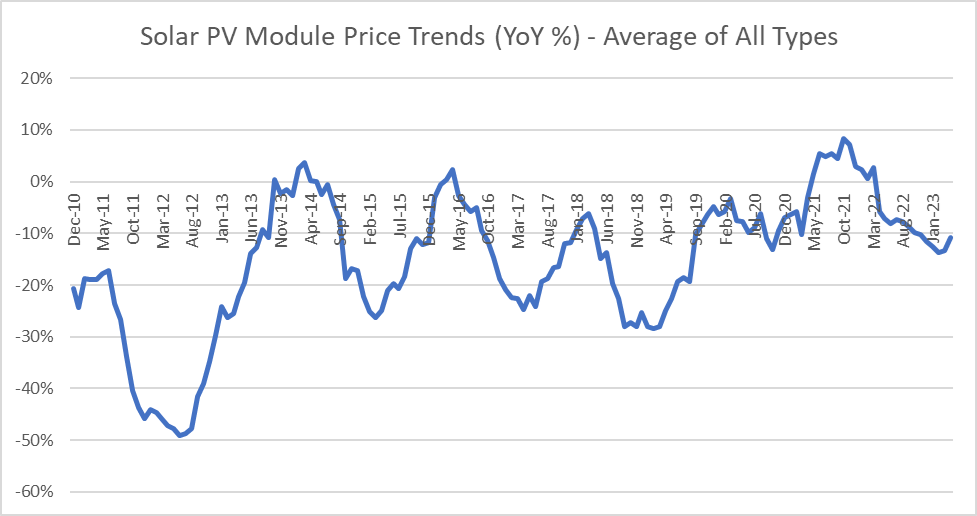
LCOE is, implicitly, an equilibrium concept. It asks us what level of revenue per MWh investors would need to earn a normal rate of return on their capital. But businesses can under- or over-earn relative to normalized profitability, including businesses that sell wind turbines or solar panels (with prices that are then used to inform inputs to LCOE analysis). Solar modules, in particular, undergo very destructive deflationary cycles on a 2-3 year cadence:
Extending the LCOE concept to upstream and downstream players (e.g. module manufacturers and installers, in the case of solar) would make it more intellectually consistent (at the cost, perhaps, of some “realism,” given depressed/excess profitability often persists longer than is strictly rational).
[1] Another way of saying this would be, to predict what’s going to happen, we rely on simple models that aim to explain what is happening now, but which are inevitably trained on data from the (recent) past. For the purposes of this piece, I see “models” and “narratives” as two sides of the same coin, though some readers might be attached to a stronger distinction between the two concepts.
[2] A pedantic but important point – most widely-cited reports on how to drive decarbonization are not really about unconditionally “reducing emissions,” but how to reduce emission with some other goal – economic growth, “sustainable development,” the national interest of a particular country or private interest of a particular company, etc. – as an equally important constraint. So, in reality, they are about reducing the emissions intensity of achieving some desiderata, with the desiderata in question usually proxied pretty well by GDP.
[3] For ease of comparison, this math follows the assumptions in Lazard’s “unsubsidized low case” from their most recent LCOE presentation (April 2023). Capital structure is 60% debt (with kd = 8%) and 40% equity (with ke = 12%).


