Shale 3.0 (?)
Some notes on US tight oil
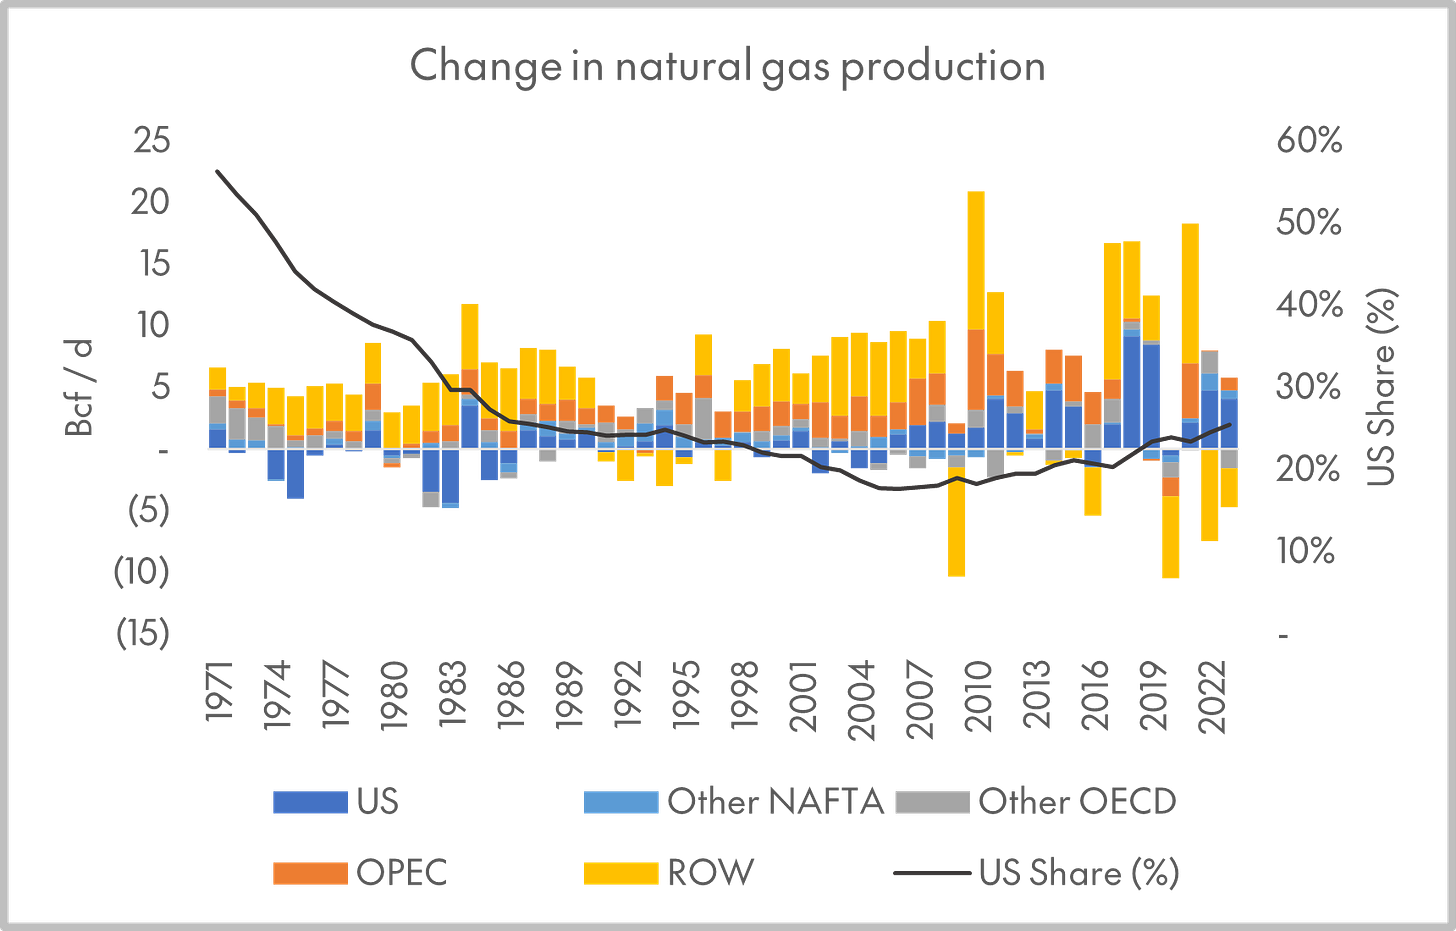
Fracking revolutionized the US oil and gas industry over the last two decades. The US has produced more gas than it consumes since 2017, and more oil than it consumes since 2023.1 In just 20 years the US “call” on overseas suppliers of oil and gas has fallen from ~15 mboe/d, during the height of the Bush years, to a surplus of nearly ~3 mboe/d.
Figs. 1-2: Annual change in natural gas and crude oil production, by bloc, from the Statistical Review of World Energy.
Fig. 3: The gap between US production and consumption of crude oil and natural gas, again from the Statistical Review (should roughly correspond to net exports plus change in inventories).
(Statistical Review of World Energy)
Independent exploration and production (“E&P”) companies are infamous for losing money, and one way to think about the “shale revolution” is as a massive, euphoric transfer of wealth from shareholders and creditors to consumers of energy (via lower prices). Analogies are sometimes drawn to other historical cases of “over-”investment in critical infrastructure, like railroads in the 19th century or fiber in the 1990s, and indeed to the deflationary growth of solar panel OEMs today.2 The industry has always generated ample operating cash flow, though a glut of domestic gas beginning in the early 2010s impaired the profitability of gas-weighted E&Ps relative to their peers with liquids-weighted production.3 But free cash flow (CFFO less capital expenditures) before asset sales tells a different story, with oil-weighted E&Ps only reaching a cumulative cash breakeven in 2020, as they pulled back on capex. Over the full 20-year period, gas E&Ps remain in the red, with cumulative free cash flow of some negative $79 billion.
Figs. 4-6: Average (i) unit cash flow from operations per oil-equivalent barrel of production, (ii) total free cash flow (cash flow from operations less gross capex), and (iii) cumulative free cash flow across E&P sub-groups.
(Bloomberg)
One way to think about cash on cash returns is cumulative free cash flow to the firm, or FCFF, divided by the increase in capital employed.4 On this metric, Hess, Occidental, and ConocoPhillips generated $234bn in FCFF, a 4.1x multiple of their increase in capital employed. Canadian Natural Resources and Suncor generated $125bn in FCFF, a 1.4x multiple of their increase in capital employed. And, in aggregate, the rest of the group generated negative ($157bn) in FCFF while capital employed grew by $131bn.
So, in hindsight, the growth of the US E&P industry, driven by the key shale oil basins of the Permian and Bakken, looks like a huge misallocation of capital. On the other hand — these companies, and especially the oil-weighted players, have all flipped to generating significant amounts of cash in the post-COVID period. Antero Resources, a gas E&P, includes this slide in its most recent presentation, calling the period from 2020 to today the era of “Shale 3.0.” Obviously, they are talking their own book (just look at the y-axis) — but it is also true that the industry, collectively, continues to grow production without outspending its operating cash flow, and that this is a new phase in the development of the US energy industry.
Fig. 7: Three eras of US shale, according to Antero Resources, a gas E&P focused on the Appalachian basin.
(Antero Resources)
If “Shale 3.0” means anything, it is the continued improvement of well economics. Shale wells decline extremely fast. Detailed public data on this is somewhat hard to find, but here’s a view from the EIA, as of 2022. The first thing that stands out is simply how big these numbers are.5 If your initial production declines by 10% a month, you will produce 90% of your estimated ultimate recovery (EUR) in 33 months. If it declines by 30% a month, you will reach that point in under 12 months. The time horizon of investment in development drilling radically shrinks, and the importance of maximizing initial production increases.
Fig. 8: Initial month-over-month decline rate assumptions used in the EIA’s Annual Energy Outlook 2022. The AEO uses separate decline parameters at the county level; the dark blue bar for each play represents the 40th-60th percentile range across the counties it extends into, and the light blue bars represent the 25th-75th percentile range.
(EIA)
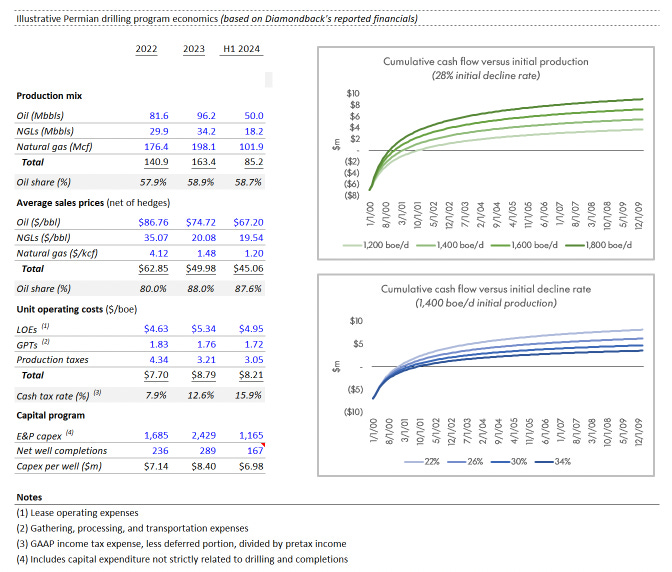
Fig. 9: Illustrative well economics for the Bakken and Permian, based on reported financials of pure-play public companies focused on each basin, and EIA decline rates.
While shale wells decline quickly — especially in the Permian — they are still able to generate very high IRRs and < 12-month payback periods, contingent on (i) low capex per completion (ideally well under $10m), (ii) low per-barrel operating costs (ideally well under $12/boe), and (iii) high enough initial production (ideally well into the 1,000s boe/d). For example, based on Diamondback Energy’s H1 2024 financials, and EIA decline rate assumptions for some of the counties it operates in6, a newly completed well can reach cash flow breakeven in under a year at $65/bbl oil (on at least some of its inventory).
On a longer-term view, it’s striking how much productivity has grown in the US oil and gas industry. According to Baker Hughes data, there are fewer rigs operating today than ten years ago — roughly 600 versus over 1,800 in 2014. But the number of wells drilled per active rig has increased by roughly a third, and the average feet drilled per well has increased by nearly three-fold. The net result is that the scale of drilling, in terms of total length drilled, is as high as it’s been at any point in the last 15 years, with fewer rigs and fewer wells being completed. This translates to more hydrocarbon output per dollar of investment. In addition, the shift in activity to oil-weighted basins (i.e. the Permian and Bakken) has increased the margins earned on each barrel-equivalent of production, given that gas in the US is perennially cheaper than oil.
Figs. 10-11: Rig count and drilling statistics from Baker Hughes and the US EIA; note different time scales in each chart.
(EIA and Baker Hughes)
Finally, a somewhat obvious but important point is that as shale wells age, they decline at a decreasing rate. Take a hypothetical company that starts by drilling 25 wells, each with an initial production of 2,000 boe/d, declining by 30% month-over-month. If the company’s goal is to drill enough wells every month to maintain flat production, it will initially have to reinvest greater than 100% of the cash flow it generates from the first 25 wells. Five years in, and it will only be drilling 3 wells per month, and the amount of money that it needs to reinvest in order to maintain production will be around ~50% of cash flow from existing wells, leaving plenty available for debt service and distributions to investors.7
Why does all this matter?
Shale / tight oil represents a large share of global upstream oil and gas investment — 27%, or $154bn per year, according to the IEA’s World Energy Investment 2024.
“Short cycle” (i.e. shale) investment represents an increasing share of capital expenditure by Western oil & gas companies. As the label suggests, one virtue of shale capex from a corporate finance perspective is that it can be quickly dialed up and down to take advantage of changing prices.
US onshore oil and gas production, and the Permian in particular, has been the incremental source of global oil supply in recent years, and thus the level of investment in US shale is material to global oil and gas supply/demand balances and trade flows.
The decline rate of existing oil and gas production is a key premise in what are fundamentally political arguments about the ‘appropriate’ level of upstream oil and gas investment that policymakers should encourage — see for example, the latest ExxonMobil Global Outlook, arguing that the increased mix of shale in global oil production increases the base decline rate of hydrocarbon supply, absent reinvestment.
(ExxonMobil)
A common working assumption in policy circles is that upstream oil and gas investment is driven by the full-cycle returns of lumpier, longer lead time projects (e.g. ExxonMobil’s offshore development program in Guyana). In a previous post, I discussed ExxonMobil’s deferred compensation plan for senior executives, whose long-term stock awards vest at five and ten-year intervals, in order to align their decision-making with the “project net cash flow of a typical ExxonMobil project” (quoting the proxy statement).
But shale capex has historically been driven by the half-cycle economics of an individual well, not the full-cycle economics of a whole field (with water pipelines, gathering infrastructure, etc.), and, given good enough drilling economics, and the fact that in the key US plays, a lot of this infrastructure has already been built, this is not necessarily irrational on the part of E&Ps. This has implications for those seeking to align the decision-making horizon of the fossil fuel industry with the (potentially longer) time frame on which transition risk may play out.
This is based on the Statistical Review data on “production” and “consumption.” The US was already a net exporter of oil in 2020, and net crude and product exports totaled 22m tonnes last year.
This comparison is unfair to the solar OEMs — breaking even, and in some years getting to high-single-digit returns on equity, strikes me as pretty good performance for asset-heavy cyclicals in an emerging market, competing in an industry where prices fall > 20% a year.
In these charts looking at the independent E&Ps as a whole, I use a non-exhaustive sample of mid- and large-cap companies with a long history. “Oil” includes Marathon, EOG, Diamondback, Devon, APA, Murphy, and Pioneer. “Gas” includes EQT, Range Resources, Coterra, Southwestern, Chesapeake, Antero, and, because of its previous focus on gas basins, Ovintiv. “Canadian” includes Canadian Natural Resources and Suncor. “International” includes the large-caps with globally diversified operations - Hess, ConocoPhillips, and Occidental.
Note — here, for FCFF, I used (GAAP EBIT + DD&A + Asset Sales - Change in NWC - Capex). In the interest of expedience, I did not go back and adjust EBIT for each company to back out exceptional and non-recurring expenses.
Note that this is equal-weighted by county within each play, and so will differ from a well- or production-weighted calculation.
Here, I focused on EIA data for Lower Spraberry and Wolfcamp-A wells, since these represent the lion’s share of the company’s completions year-to-date.
Please reach out if you would like to see the .xls template for this hypothetical!


