Measuring what matters
How will analysts use EU Taxonomy data?
TLDR: The EU Taxonomy is an ambitious piece of financial regulation designed to get companies to disclose standardized data on how their activities contribute to the EU’s climate goals. For it to work as intended, analysts need to be able to determine whether Taxonomy-aligned investments are creating value (incremental EBIT vs. incremental capital employed).
In 2019, the European Commission announced its plans for a “European Green Deal” – essentially, the EU’s grand strategy for dealing with climate change. The headline goal of the Green Deal is to reduce the continent’s greenhouse gas (GHG) emissions by 55% (relative to 1990 levels) by 2050.
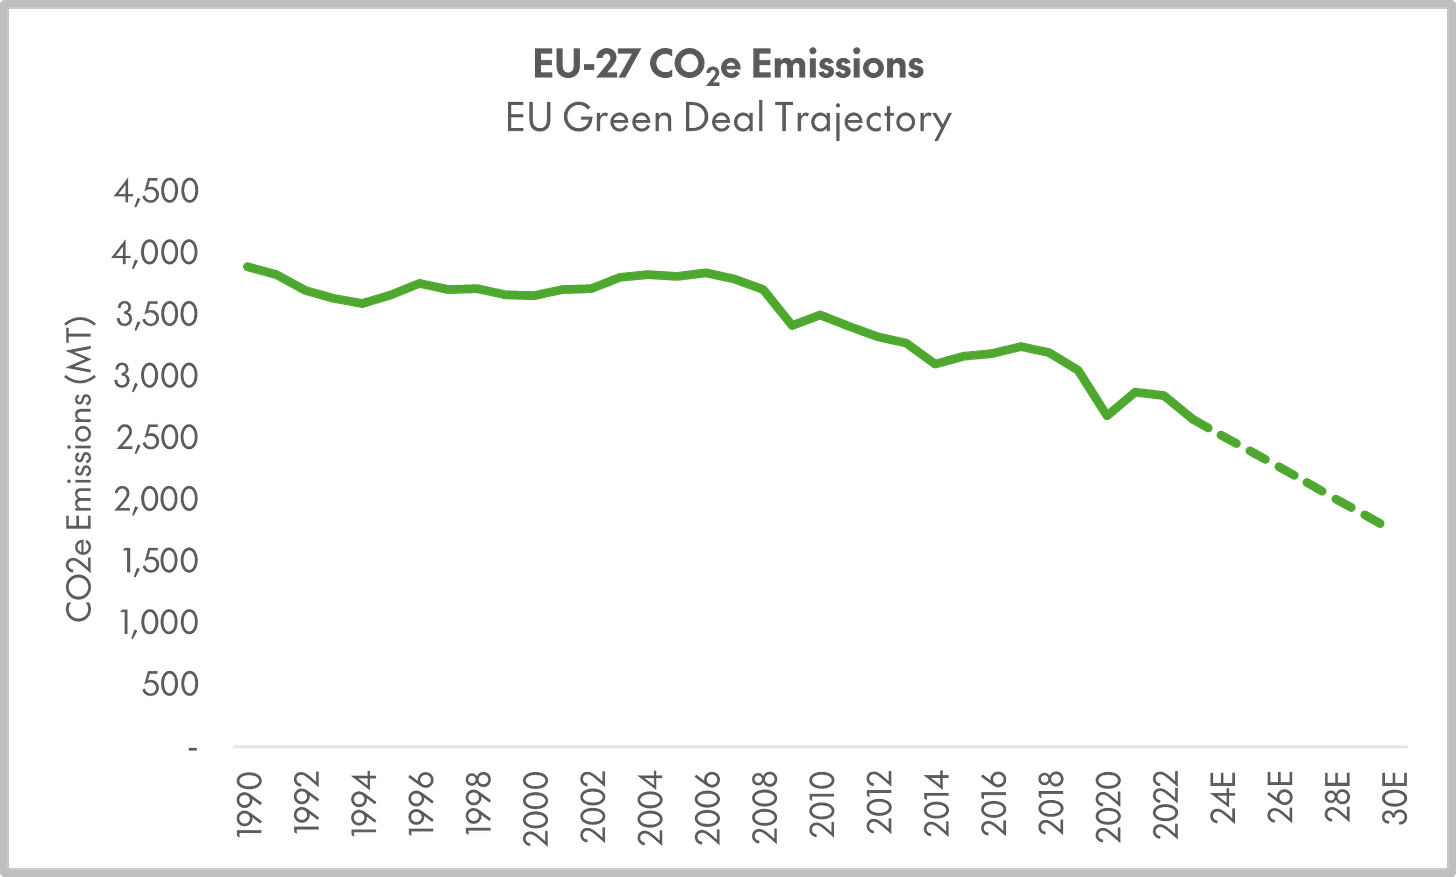
That target is more ambitious than it might initially appear when plotted against historical EU CO2e emissions. EU emissions peaked in 2006, at 3.8 GtCO2e, which at the time, was 12% of the global total. Since then, they’ve fallen by about 70 MT per year (an average rate of 2.2%). To hit the Green Deal target, that pace will need to roughly double in absolute terms, to about 130 MT a year, and nearly triple in percentage terms, to nearly 6%.
(Statistical Review of World Energy)
Emissions can be thought of as a product of (1) population, (2) GDP per capita, (3) the energy intensity of GDP, and (4) the emissions intensity of energy (the Kaya identity). After a long plateau in the 1990s and 2000s, EU emissions fell by 30% from 2005 to 2023, compared to 23% for Japan and 17% for the US. The EU’s faster progress on reducing emissions, compared to the US, is a function of (1) much slower population growth, (2) roughly equivalent real GDP per capita growth, and (3) slightly faster improvement in energy intensity per unit of GDP, and in CO2e emissions per unit of energy.1
The point of stepping all the way back to this big-picture view is to emphasize that the EU’s 2030 target is pretty ambitious. It is especially ambitious if you consider that the stated goal of EU climate policy is not just to drive emission reduction, but also to drive a new era of “green growth.” The language from the European Commission statement announcing the Green Deal is telling:
The European Green Deal is our new growth strategy – for a growth that gives back more than it takes away. It shows how to transform our way of living and working, of producing and consuming so that we live healthier and make our businesses innovative. We can all be involved in the transition and we can all benefit from the opportunities. We will help our economy to be a global leader by moving first and moving fast.
For Europe, returning to ≥ 2% real GDP growth from 2023 to 2030, at the current rate of improvement in energy intensity, would require a 4.5% annual reduction in the emissions intensity of energy, compared to 1.2% from 2019-23. Conversely, hitting this level of growth while holding the current rate of improvement in the CO2e intensity of energy constant would require the energy intensity of GDP to decline by 6.5% a year, compared to 3.2% from 2019-23.
This kind of acceleration starts to push up against the performance envelope of what a large economy can do in peacetime. The European Commission is right to frame the challenge in terms of capital formation - deploying the clean energy technologies (solar panels, wind turbines, EVs, grid-scale batteries, etc.) that will make this pivot possible.
The InvestEU site pegs the required annual investment in the energy system at €336bn above the 2011-20 average, plus an additional €130bn “to deliver on [other] environmental objectives.” To contextualize these numbers, gross fixed capital formation across the EU was ~€3.8tn over the last 12 months. It was ~€3.2 trillion at the end of Q1 2020. Given that European producer price indices are still nearly 40% above pre-pandemic levels, this means that investment is actually down 15% in real terms compared to before the pandemic.2
(Eurostat)
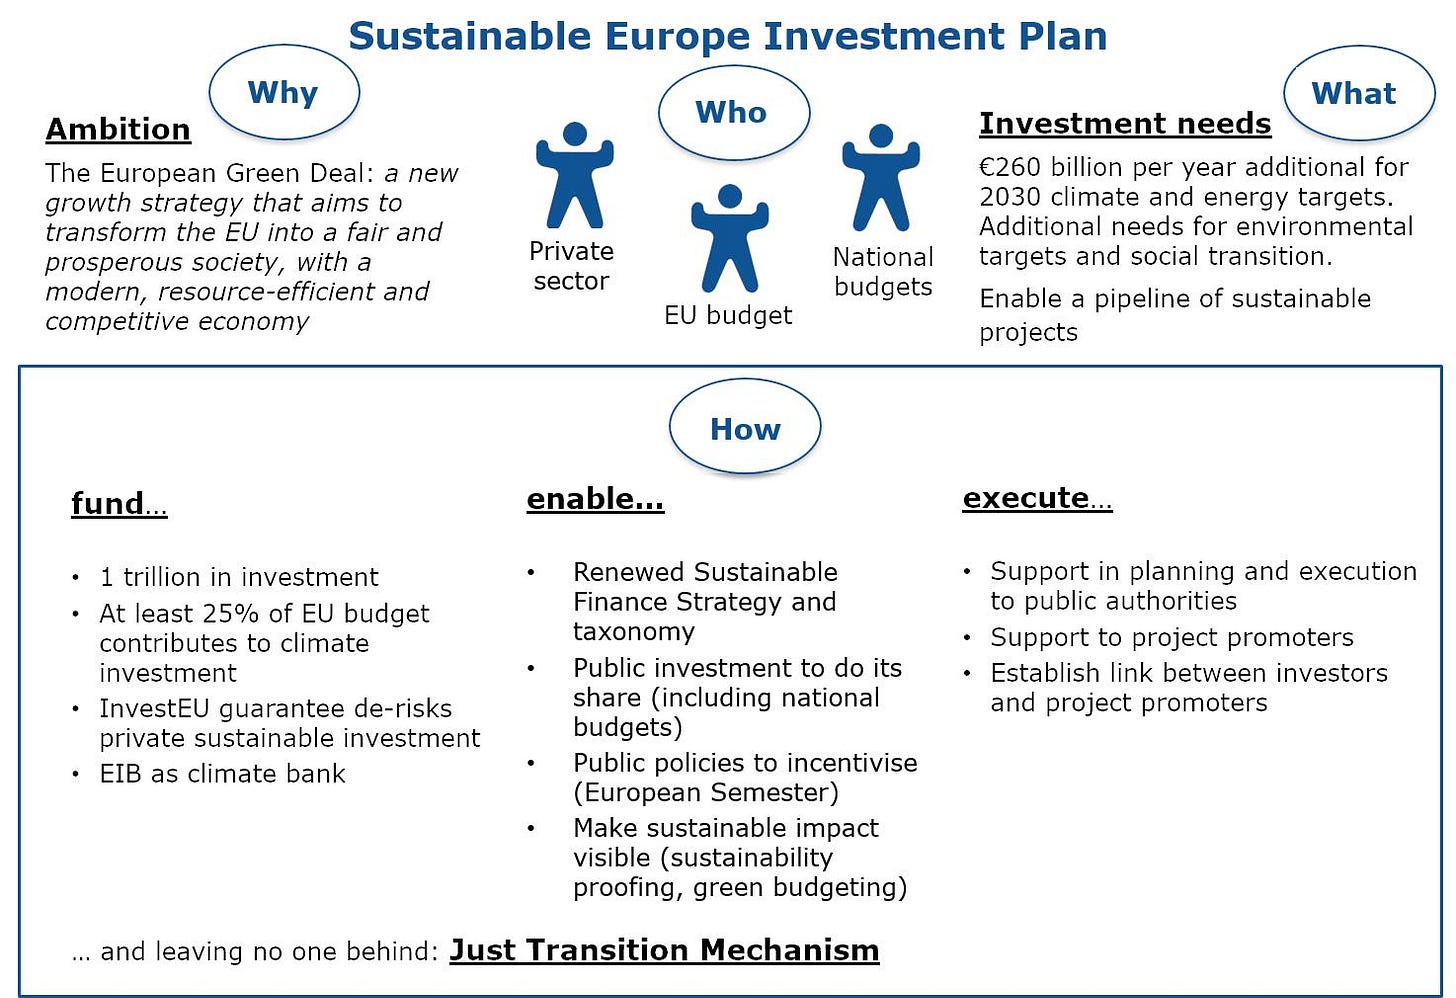
EU policymakers are hoping that at least some of that investment will come from the private sector. The idea of levering up public spending on the energy transition with private capital is not unique to the EU (see, for example, the US DOE’s Loan Programs Office, which provides subsidized debt to targeted industries in order to see them through to “commercial liftoff”). What is distinct is how the EU has incorporated this goal into financial regulation writ large.
(EUR-Lex)
Targeting public and private investment toward “climate and energy targets” requires identifying the specific activities - from renovating old, energy-inefficient buildings to producing biofuels - that map onto those targets, and getting companies to consistently track and report on those activities. This is the idea behind the EU Taxonomy Regulation, which is basically designed to get a huge amount of data on these activities into the public domain.
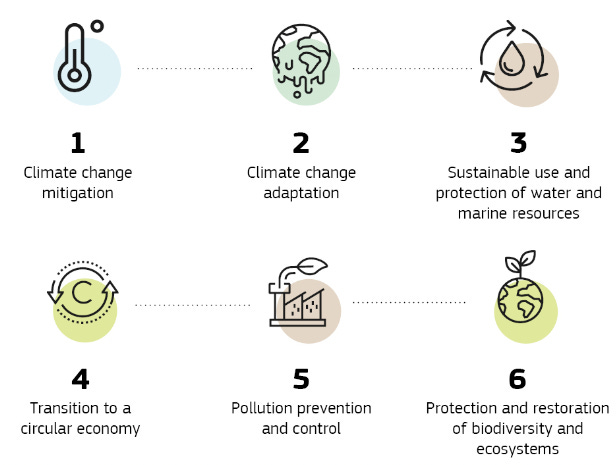
The core of the Taxonomy is to identify activities that “substantially contribute to” at least one of six environmental objectives and “do no significant harm” to any of the others. Activities can be further classified as “transitional” (when there is no low-carbon alternative) or “enabling,” if they contribute to some other activity that directly advances the six objectives. Activities are considered “eligible” if they can fit these criteria, and “aligned” if they actually do.
(European Commission)
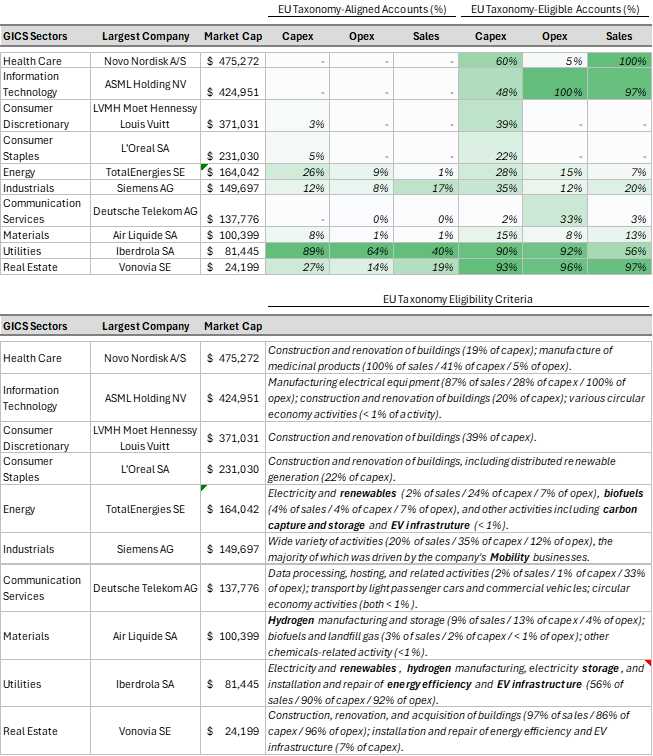
This is what the disclosures look like for the largest European publicly traded company in every sector, excluding financials. Market caps below are in millions of dollars.
(Company Reports)
Clearly, Taxonomy aligned reporting is producing a lot of information, including revenue and capital expenditure (“capex”) breakdowns that are much more detailed than typical corporate reporting. For example, Air Liquide’s Taxonomy data includes revenue for many activities that are far, far below any traditional financial materiality threshold. For example, Air Liquide earned €3.5mn of revenue from “manufacture of biogas and biofuels,” €2.8mn from “electricity generation from renewable non fossil gaseous and liquid fuels,” and €0.1mn from selling solar power. Each of these categories represented less than 0.01% of Air Liquide’s ~€28bn in sales.
Aggregating all this information that would otherwise go unreported across the universe of companies that are required to make Taxonomy disclosures - essentially all European companies that meet at least two of three eligibility criteria (250 or more employees, €40mn or more in revenue, and €20mn or more in assets) - is potentially very useful. Collectively, non-financial public companies in the EU reported $224bn in Taxonomy-aligned capex for 2023, up 42% from $158bn in 2022. This compares to overall capex, in the meaning of the Taxonomy regulation, of $1.35tn.3
Note: Bubbles in the figure below are sized based on each industry’s total capital employed in fiscal 2023.
(Bloomberg)
EU regulators imagine that this data will ultimately help marshal the hundreds of billions of euros of private investment required to achieve the Union’s climate goals. But it is somewhat unclear what the pathway for making this happen actually looks like. I think there are really three potential “stories” for explaining how this is supposed to work:
Financial institutions like banks and asset managers will expand their lending, underwriting, and investing support for “Taxonomy-aligned” activities, in order to satisfy non-financial demand for “green” characteristics from their end customers (e.g. an asset manager’s clients) or deliver on their own goals and targets.
EU and national policymakers will be able to use Taxonomy reporting to track whether investment in high-priority areas (like hydrogen manufacturing and storage) is in line with top-down, Europe-wide targets. The Taxonomy data will serve as a barometer for flagging areas where additional policy measures (tariffs, tax credits, subsidized investment, etc.) are needed to close the gap with EU goals.
Taxonomy data will drive private investment in EU priority areas the old-fashioned ways - by helping users of financial investments evaluate whether Taxonomy-aligned activities are creating value, and to ring-fence Taxonomy-aligned investment from legacy, non-aligned or non-eligible activities.
Out of these three stories, my hunch would be that the first story is already happening, to a certain extent, but it will only be able to close a small chunk of the EU’s green investment gap. The second story is guaranteed to happen, and is likely enough to justify the Taxonomy regulation on its own, but begs the question of whether EU and national politicians will actually act on the signals generated by Taxonomy data. It’s the third story that is potentially really interesting.
By isolating very detailed revenue, operating expense, and capex data, Taxonomy-type reporting could (in theory) get us part of the way to being able to track operating profit, capital employed, and free cash flow for Taxonomy-aligned activities. This would allow users of financial statements to add back Taxonomy-aligned investment to free cash flow, in order to value a company’s existing, non-Taxonomy-aligned business (perhaps at a higher, “fossil” discount rate) and then to separately value whatever new, sub-scale Taxonomy-aligned business it is investing in (perhaps at a multiple of book value if it is not yet cash flowing).
Without this kind of standardized data, and in the absence of voluntary breakouts, segment reporting, and so forth, “green” investment that is not yet profitable appears as a drag on margins and free cash flow. Effective disclosures can help show it for what it is - a potentially rational capital allocation decision.
The tricky thing is that the relationship between Taxonomy disclosures and economic reality - and thus, its fitness for doing this kind of analysis - varies widely from company to company, and industry to industry. Just looking across the list of largest companies by sector, there are at least three completely different interpretations of the Taxonomy data:
For a company like LVMH, which sells liquor and handbags, “eligible” investment is what the company spends on buying, renovating, and leasing buildings. “Aligned” investment is the subset of that spending that clears an energy efficiency threshold. LVMH doesn’t directly generate revenue, or incur operating expenses, from these activities, but it potentially earns a return for the company via avoided energy costs - which are not part of Taxonomy or any other standard financial reporting.
For an industrial gas company like Air Liquide, Taxonomy-eligible activities reflect a subset of the company’s core business - in Air Liquide’s case, manufacturing and storing hydrogen, plus some biofuel related activity. Taxonomy reporting allows investors to track that business’s evolution from high-carbon to low-carbon feedstocks over time. Taxonomy-aligned capex largely maps onto Taxonomy-aligned revenue, allowing analysts to frame the return on investment.
For a company like Iberdrola, whose core business - generating and distributing electricity - falls under the Taxonomy’s six objectives, Taxonomy reporting is (ironically) fairly superfluous, given that almost everything the company does is a Taxonomy-eligible activity.
Sorting between these cases is key to doing any kind of large-scale, cross-industry work based on Taxonomy data. Another important caveat is the Taxonomy’s totally baffling definition of “operating expenditure,” which excludes the vast majority of IFRS operating expenses.
(Company Reports)
The Taxonomy definition of “opex” is, effectively, (non-capitalized) R&D maintenance costs related to Taxonomy-eligible and Taxonomy-aligned investment. There is some logic to this, since the regulators clearly envision Taxonomy reporting being most directly embedded in the capital budgeting process. But it makes it does not get us much closer to answering the key question. What is the incremental operating profit from Taxonomy-aligned activities, and how much capital do companies need to invest to generate it?
Only once analysts are able to calculate this are they able to figure out the return on capital employed (ROCE) from Taxonomy-aligned investment. So far, EU Taxonomy data is a promising start, but, perhaps inevitably, there is a lot of work left to do for creative analysts trying to figure out how it foots with the drivers of business value.
Note that the chart below uses nominal, current-dollar GDP rather than real. Using real GDP erases the difference in GDP per capita growth between Europe and the United States (an analysis starting from a more recent year would show worse performance for Europe). Please reach out if you are interested in an .xls version of either.
Real US fixed capital formation is up 3.6% over the prior 12 months, and up 8% vs. pre-pandemic.
The denominator for Taxonomy capex calculations includes assets acquired through acquisitions.


