Bending the (cost) curve
Upstream emissions and O&G competitiveness
In 2021, the International Energy Agency (IEA) published a special report outlining a pathway for reaching Net Zero by 2050 (NZE 2050). It’s sort of hard to pin down what NZE 2050 was, exactly, because it was self-avowedly not a forecast or set of predictions. It was also not a target or plan. Instead, it was (and remains, in its more recent incarnations) a “pathway” or “scenario” - an outline of the optimal way to decarbonize, if governments around the world collectively decide to do that. Since it came out, the NZE scenario has been incorporated into the IEA’s annual World Energy Outlook alongside the longer-running “Stated Policies” (SPS) and “Announced Pledges” (APS) scenarios. SPS and APS, unlike NZE, are anchored in the energy policies that countries around the world have actually committed to. The IEA also published a more fulsome stock-take on the NZE pathway last summer.
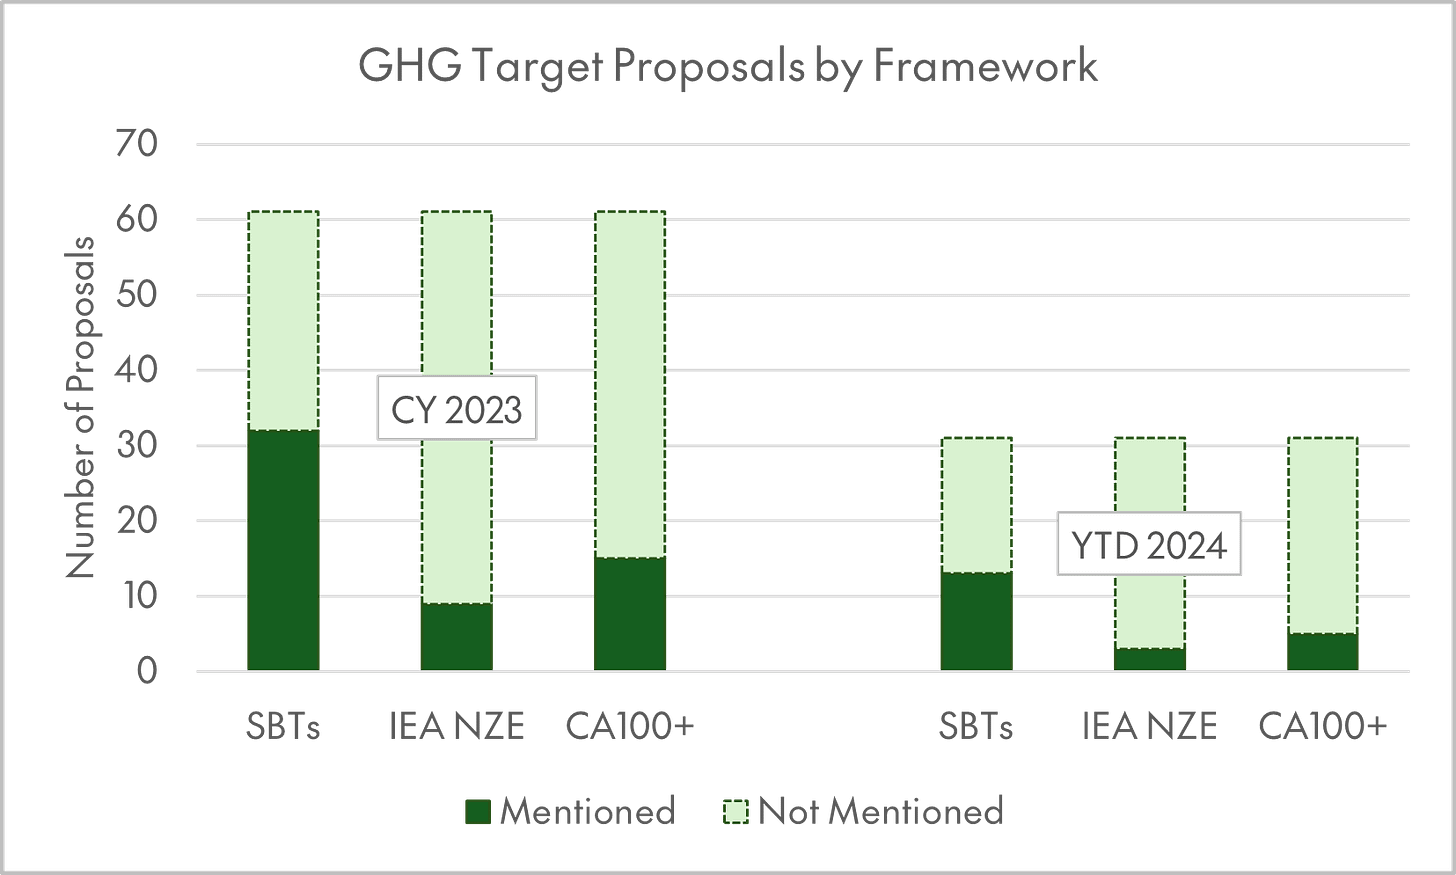
What is somewhat surprising is the way that the NZE has been metabolized in the shareholder activism world, as an acid test for whether a company’s approach to capital allocation1 is aligned with the Paris Agreement’s goal of reaching net zero by 2050. For example, in the shareholder proposal universe that CAS tracks, twelve GHG-target-related proposals that made it to a vote (or are on track to be voted this year) refer to the NZE scenario. These proposals use(d) the NZE 2050 report as a warrant to argue that oil and gas producers should stop investing in new projects, and that banks and insurance companies should stop doing business with companies expanding fossil fuel production.
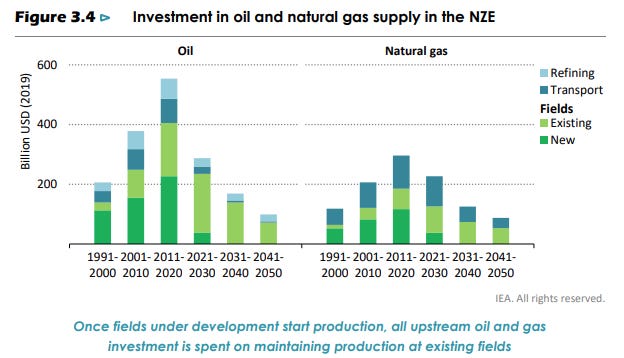
This is because the original NZE report included this fateful passage (and accompanying chart), which argues that, as long as energy demand growth is low enough, and renewable deployment is fast enough, no new, green-field oil and gas projects need to be developed in order to meet the world’s energy needs:
The trajectory of oil demand in the NZE means that no exploration for new resources is required and, other than fields already approved for development, no new oil fields are necessary. However, continued investment in existing sources of oil production are needed. On average oil demand in the NZE falls by more than 4% per year between 2020 and 2050. If all capital investment in producing oil fields were to cease immediately, this would lead to a loss of over 8% of supply each year. If investment were to continue in producing fields but no new fields were developed, then the average annual loss of supply would be around 4.5%. The difference is made up by fields that are already approved for development.
(International Energy Agency)
The math here is admittedly pretty 30,000-foot. There are also two big hedges. One is the level of investment in existing fields, which includes plenty of fields where production is relatively stable, or still growing (like in the Permian). The other is fields that have already been approved (reached FID). I’m thinking here of the substantial pipeline of projects coming online off the coast of Brazil over the next few years (~2,300 kboe/d, per Petrobras), and Guyana’s Stabroek block. Nevertheless, the IEA’s 2021 conclusion was pretty striking. The drawdown in oil and gas capital expenditure (capex) it implies is also an obvious source for renewable energy capex (albeit with different risk/reward characteristics), going some ways toward “mobilizing the trillions” required to build out low-carbon infrastructure.
So it’s interesting to track how the IEA’s thinking on what a realistic net zero pathway might look like has changed over the last two-odd years. In a nutshell, the IEA has gotten more pessimistic on energy efficiency, fossil fuel consumption (12 percent higher in 2030 than in the original NZE), wind power deployment, carbon capture, and hydrogen. On the flipside, it’s gotten more bullish on solar deployment, electrification, grid-scale batteries, and EV adoption. One takeaway is that modular widgets (solar panels and batteries) continue to surprise to the upside, as expanded manufacturing capacity, falling prices, increased customer adoption, and technological learning follow each other in a virtuous cycle. Conversely, megaprojects of various kinds have been slower to get off the ground.
(International Energy Agency)
Here’s the updated text on oil and gas investment from the revised NZE 2050 report. Note that the underlying logic of the NZE model is that falling demand drives an orderly abandonment of oil and gas assets, starting with the highest-cost fields and moving down the cost curve, leaving just onshore Middle Eastern production, and, perhaps, offshore Brazil in the money in 2050.2
No new long-lead time upstream oil and gas projects are needed in the NZE Scenario, neither are new coal mines, mine extensions or new unabated coal plants. Nonetheless, continued investment is required in existing oil and gas assets and already approved projects. Sequencing the decline of fossil fuel supply investment and the increase in clean energy investment is vital if damaging price spikes or supply gluts are to be avoided.
The drop in fossil fuel demand and supply reduces traditional risks to energy security, but they do not disappear – especially in a complex and low trust geopolitical environment. In the NZE Scenario, higher cost producers are squeezed out of a declining market and supply starts to concentrate in large resource-holders whose economies are most vulnerable to the process of change. But attempts by governments to prioritise domestic production must recognise the risk of locking in emissions that could push the world over the 1.5 °C threshold; and that, if the world is successful in bringing down fossil demand quickly enough to reach net zero emissions by 2050, new projects would face major commercial risks.
This makes sense from the perspective of a system planner, which is, implicitly, the NZE scenario’s approach - what is the “optimal” path for the global energy system, with emissions as a binding constraint, and assuming global cooperation is no object? But, as the passage above acknowledges, it (by design) neglects the possibility of strategic behavior by the agents that make up the system. In the IEA’s APS, which falls somewhere between the SPS and NZE scenarios in its assumptions, liquids production falls only modestly by 2050 in Latin America (-18 percent) and the Middle East (-24 percent), but much more dramatically in the US (-45 percent), Russia and Central Asia (-65 percent) and Asia-Pacific (-74 percent). This would be a future in which OPEC goes from 35 to 43 percent of global liquids supply. This market share shift, and the resulting potential for exercising market power, would be more dramatic under the NZE. Rather than cleanly converging to the least cost solution, oil prices would depend on whether OPEC producers focus on volume or value, i.e. how much excess capacity they choose to maintain.3
All this has the CAS team thinking about the way the global oil and gas supply curve will interact with calls for a faster energy transition. In a world of “good barrels and bad barrels” where security-of-supply and upstream emissions are given comparable (or more) priority than bringing down Scope 3 emissions as quickly as possible, is there a path, however narrow, to justifying oil and gas capex as a way to displace the highest-cost, dirtiest barrels, reducing the emissions intensity of the marginal barrel and overall energy emissions? It’s not lost on me that this is the oil and gas industry’s preferred framing for how to think about IOC / E&P investment levels over the long run. Still, I think it’s worth laying out some of the basic dynamics at play, since this is well on its way to becoming a dominant framework in DC, Houston and elsewhere.
There is a strong, but by no means perfect, correlation between the cost to produce a barrel of oil and its (upstream) emissions intensity. I should note that the lifecycle emissions of a barrel of oil can vary widely (this Carnegie piece highlights examples with anywhere from 475 - 770 kg of “well-to-wheel” emissions per barrel) and upstream emissions can represent as much as half of total emissions. The relationship between unit costs and emissions intensity exists because both costs and emissions are downstream from energy returns on investment (EROI). All the energy inputs it takes to get a more expensive barrel out of the ground have a CO2 (and methane) cost in addition to a dollar cost.
(International Energy Agency)
(CAS analysis based on company reports; data available on request)
This means that higher carbon taxes and prices, applied more broadly, would tend to steepen rather than reshuffle the global oil and gas supply curve. Here’s a snapshot of how all-in costs (direct production costs, production-related taxes, and DD&A) for a group of the world’s largest publicly traded oil and gas producers look with and without a $150 / tonne carbon price.4 5
This year, CAS is tracking nine “in play” shareholder proposals that are ultimately about how the oil and gas industry should allocate its free cash flow. In addition, there are five more proposals on track to be voted on this proxy season aimed at banks and insurance companies that lend to, insure, and underwrite securities offerings for energy companies.
Winning over the investors who will be voting on these resolutions requires bridging the gap between the proponents’ impact-for-the-planet perspective with a return-focused approach that centers “climate-related risks and opportunities.” Thinking with and through the oil and gas supply curve, with a carbon-price adjusted view of costs, and a “mid-transition” view of demand, is a good way to start.
i.e. do you reinvest cash flows into either some kind of green opportunity, or your legacy business, or do you harvest them and return capital to shareholders?
The IEA’s NZE envisions just ~42 EJ of oil production in 2050, or about ~21 million barrels per day, down almost 80 percent from 2022 levels. In the NZE scenario, nearly all of this is used as feedstock for the chemical industry (roughly flat with current non-energy use).
There are obviously multiple feedback loops in play here. For example, one reason why, say Saudia Arabia’s fiscal breakeven oil price is so high (>$80 per barrel versus single-digit production costs for Aramco) is so that the Kingdom’s government can fund a transition away from a hydrocarbon-dependent economy. But, in turn, an upshot of expanding gas, nuclear, and renewable power production, displacing oil-fired generation, is that it frees up more crude for export.
Costs here are for 2022, which in all but two cases was the most recent available data year for climate metrics.
As an aside, it’s striking is that even high carbon prices don’t radically change the price of a barrel of oil. Carbon taxes/prices, unless set punitively high, may increase the operating costs of fossil-reliant assets, but don’t radically change the math on buying an EV or replacing a gas power plant with solar-plus-storage, because the fully-loaded cost of green infrastructure and assets has to compete with the marginal cost of running the existing cars, boilers, power plants, factories they need to replace (or rather, replacing the fossil alternative can only happen as quickly as the underlying asset stock turns over, which could be 30+ years for generation capacity or ~8 years for passenger vehicles, etc.). This, along with the catalytic impact of learning effects once production/capacity growth starts to kick in, is why supply side policies are such an accelerant to the energy transition.


