Limiting reagents
Electric power becomes a growth industry
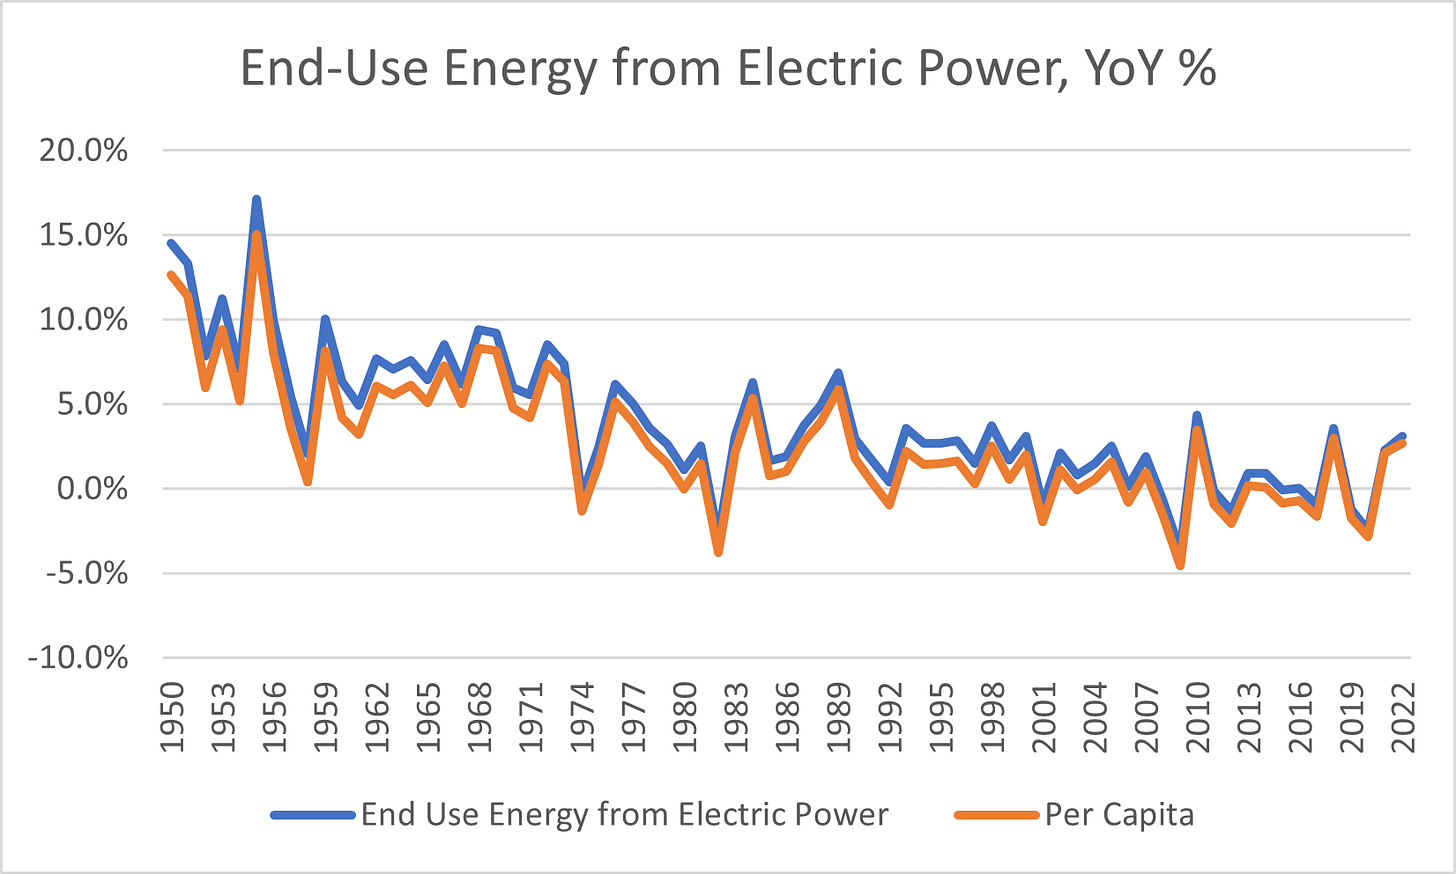
About 90% of the US’s wind farms, and nearly 100% of its grid-scale solar panel installations, came online after 2008. This has been a remarkable period in the recent energy history of the US, not just because renewable penetration has grown so much, but because after many decades of growth, electric power consumption plateaued and then started to fall. While primary energy consumption per capita peaked from 1973-1979, primary energy consumption by the electric power sector continued to rise into the 2000s, though at a slower rate than the roughly 5% annual growth in electricity demand from 1950-2000, let alone the double-digit growth rates of the 1950s.
Slow demand (“load”) growth made it much easier for natural gas and renewables to displace coal generation. Since ’08, the US has replaced 107 GW worth of retired coal capacity, which was on roughly 80% of the time; 8760 * 80% * 107 GW = 750 TWh of energy, or 17% of the electricity generated in the US in 2007. That coal capacity has been replaced by 83 GW of natural gas generation, 132 GW of wind, and 93 GW of solar, which, on average, produce power 35% of the time, adding 936 TWh of generation and more than offsetting the retired coal plants.
Because power plants are dispatched in order of marginal cost, the proliferation of zero-marginal-cost renewables, and relatively cheap shale gas,[1] has led to falling capacity factors for coal plants, and the gradual exit of the highest-cost generators.
So, it’s notable that we’re poised for much faster growth in electricity demand over the coming decades. In fact, the period from 2021-22 was the first time since 2004-2005 that end-use consumption of electricity increased by more than 1% for two consecutive years.
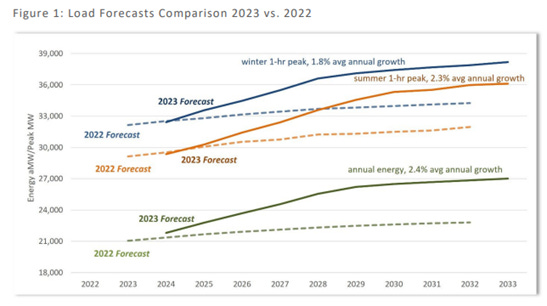
US power market operators (“ISOs” and “RTOs”), public utility commissions, and power companies regularly publish long-range forecasts and scenarios for guiding power sector investment. Across the US, regulators and market participants are telling us that they anticipate at least 1-2% annual growth in electricity demand for many years to come.
A few illustrative examples:
The California Energy Commission forecasts 1.2% annualized growth in electricity consumption from 2020-50 under its “business as usual” reference scenarios, and 2.2%-2.8% annual growth in its “electrification” and “mitigation” scenarios, which feature more aggressive emissions reduction.
The Pacific Northwest Utilities Conference Committee is forecasting 2.4% annualized growth in electricity use to 2033, a huge step up from prior forecasts.
The Electric Reliability Council of Texas is modeling a 2.5% annual growth rate (!) in annual energy consumption between 2022 and 2032.
While electricity demand in Texas has been juiced by population growth, market operators, utilities, and regulators seem to be raising their forecasts in slower-growing parts of the country as well - for example, the Mid-Atlantic market operator, PJM, is forecasting a 2.2% annual growth rate in energy use between 2023-2039.
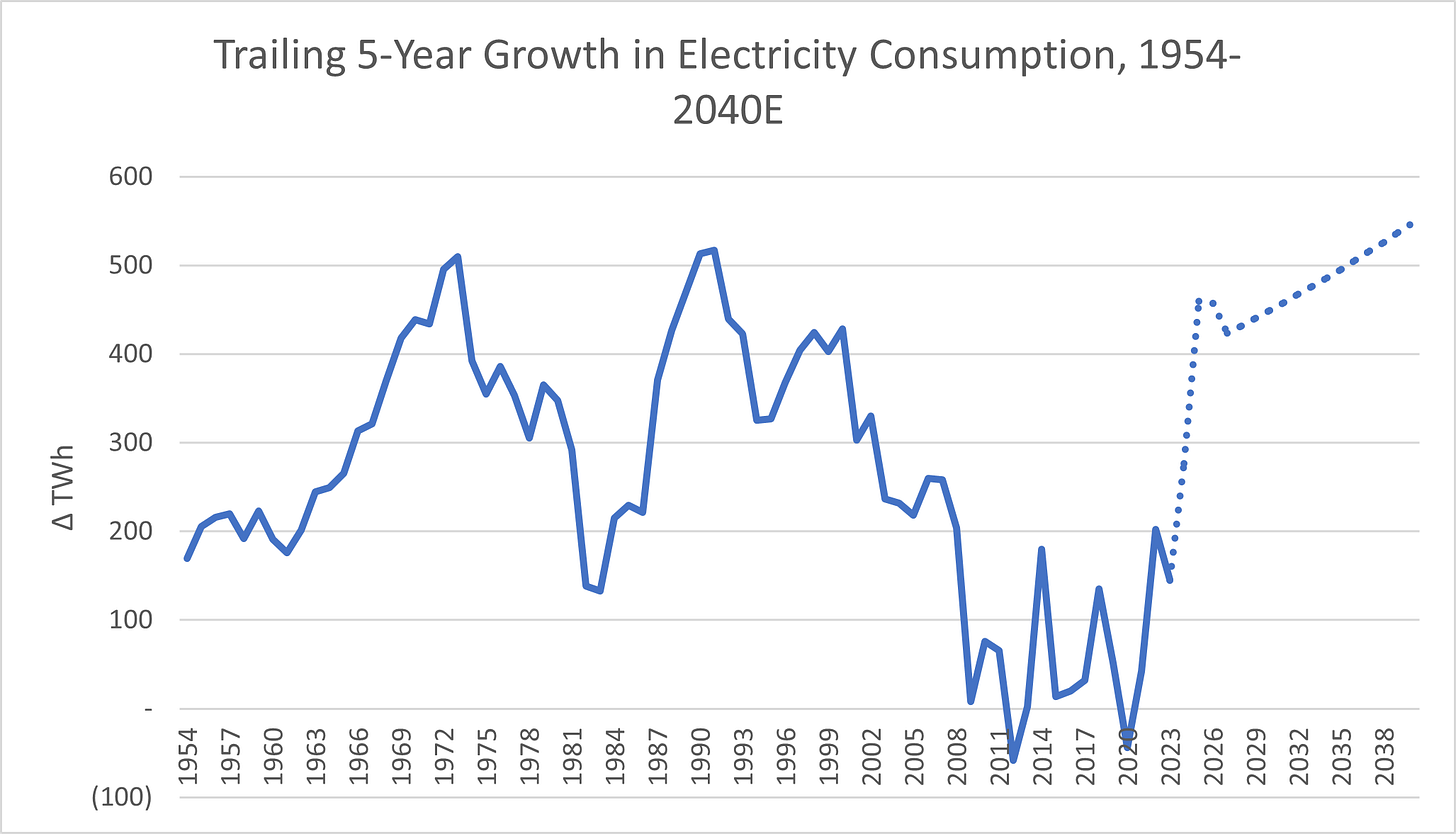
Even 1.5% annualized growth in nationwide electricity demand would imply one of the largest sustained upswings in electricity sector growth in American history. 2.0% growth (depicted below) would be unprecedented.
Everywhere in the US, electricity demand is growing (and growth forecasts are being revised upward), while dispatchable thermal plants are slated to retire. They’re being replaced by variable, inverter-based resources (solar and wind), which is great for the emissions intensity of the grid, but, especially toward the end of the decade, could start to present a challenge for “resource adequacy” (being able to keep “expected loss of load expectation” below the NERC standard of one day in ten years).
One observation that pops pretty straightforwardly out of these dynamics is that the faster that electricity demand is growing, the faster solar and wind resources need to be deployed just to keep emissions from electric power at a standstill.
Illustratively, the US is on track to deploy about 45 GW of wind and grid-scale solar capacity this year. Depending on the capacity factors of these new renewable resources, this pace of capacity addition can drive ~90-120 TWh of annual generation, or 2.2-2.9% of current US electricity production. Under higher-electrification scenarios, this is just about enough to serve additional demand (though in reality, additional storage and firm, low-carbon resources would be needed as well), and, at best, it can solve for about ~1.0-1.5 ppts of mix shift to low carbon power a year, vs. ~38% low-carbon power (including hydro, nuclear, and geothermal) today.
Another observation is that in many cases, the decarbonization of the grid sets a hard limit on the rate companies can be expected to cut their own emissions. Illustratively, for the top 100 emitters in the S&P 500, excluding utilities, about ~27% of global emissions come from purchased electricity (“Scope 2”).
Assuming business-as-usual growth in production volume, these companies, which are increasingly being asked to set more aggressive, “science-based” emissions targets, have three potential plays (setting aside management of “market-based” Scope 2 emissions through clean power procurement):
“Electrify everything” – using electricity to directly substitute for fossil fuel energy sources.
“Energy efficiency” – reducing the amount of energy input per unit.
“Emissions abatement” – reducing the unit GHG intensity of energy from fossil fuels (e.g. through point-source carbon capture).
In some ways, electrification is the cleanest play out of the three, but, in the aggregate, it’s limited by the emissions intensity of the grid. There’s a circular reference here, since decarbonizing the grid is made more difficult by increasing load growth. Setting “science-based targets” at the individual company level is all well and good, but the gating factor to delivering on them is going to be these kinds of system-level dynamics, not the tenacity of individual chief sustainability officers.
[1] At year-to-date commodity costs and national-average capacity factors, the fuel cost of coal and gas CCGT generation is about the same in the US ($25/MWh) but fixed and variable operating and maintenance (O&M) costs for coal plants, which play into breakeven costs and thus market entry/exit decisions, tend to be higher.


